OPEN-SOURCE SCRIPT
Actualizado Volatility Drag Oscillator
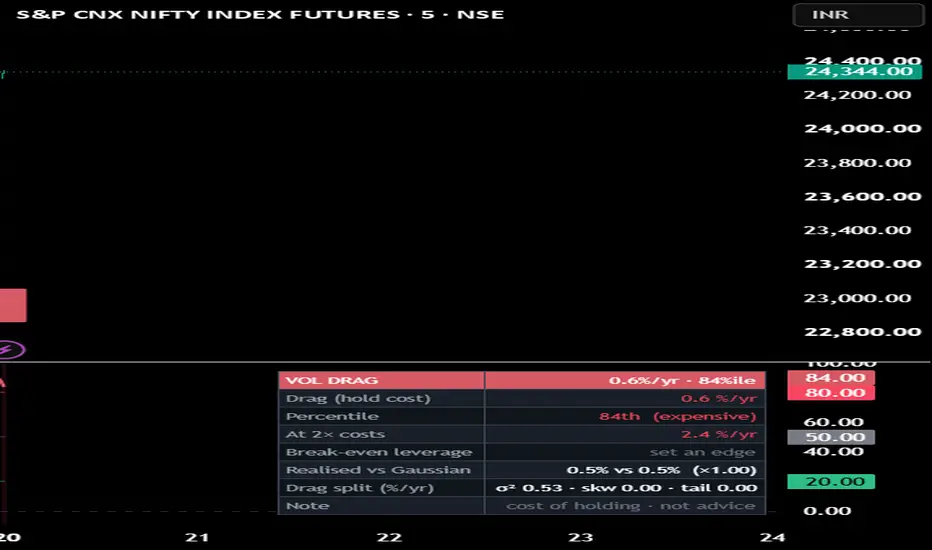
Volatility Drag Oscillator — what is holding exposure costing you, and what does leverage do to it?
Compound growth is g = μ − σ²/2; under leverage, g(L) = L·μ − L²·σ²/2. Return scales with L, drag scales
with L² — which is the whole reason leverage does not raise your probability of success. Volatility is
estimable in hundreds of bars; drift needs decades. So this tool measures only the knowable half:
- DRAG = σ²/2 annualised (Yang-Zhang by default; Close-to-close / Parkinson / Garman-Klass /
Rogers-Satchell selectable to see estimator disagreement = gap-risk information), EWMA-smoothed and
ranked into a percentile so you know if today is a cheap or expensive time to hold.
- DRAG DECOMPOSITION — realised drag split into its exact cumulant pieces: variance (σ²/2) + skew +
excess-kurtosis, shown as "σ² · skw · tail" in %/yr. A fat-tail warning tells you HOW MUCH of your
drag is tails, not just that they exist — and it compares realised drag to its own Gaussian part, so
it can't be fooled by estimator choice.
- LEVERAGE CURVE — drag at 1×/2×/3×, plus break-even L_be = 2μ/σ² and Kelly = μ/σ², shown ONLY as
conditionals on an edge YOU enter. The script never estimates drift, and says why.
READ IT how you like: a familiar 0-100 percentile OSCILLATOR in the pane (cheap<20, expensive>80,
midline 50, like an RSI of holding-cost), or the absolute drag %/yr line. On price, a heat-RIBBON and
green/red regime triangles show cheap→expensive to hold — VOLATILITY regime, direction-agnostic. A red
marker means "expensive, size down", never "go short".
No directional claim and no backtest — there is nothing here to fit. Descriptive risk context, not advice.
Leverage magnifies losses; this shows one cost of it, not all risks.
Compound growth is g = μ − σ²/2; under leverage, g(L) = L·μ − L²·σ²/2. Return scales with L, drag scales
with L² — which is the whole reason leverage does not raise your probability of success. Volatility is
estimable in hundreds of bars; drift needs decades. So this tool measures only the knowable half:
- DRAG = σ²/2 annualised (Yang-Zhang by default; Close-to-close / Parkinson / Garman-Klass /
Rogers-Satchell selectable to see estimator disagreement = gap-risk information), EWMA-smoothed and
ranked into a percentile so you know if today is a cheap or expensive time to hold.
- DRAG DECOMPOSITION — realised drag split into its exact cumulant pieces: variance (σ²/2) + skew +
excess-kurtosis, shown as "σ² · skw · tail" in %/yr. A fat-tail warning tells you HOW MUCH of your
drag is tails, not just that they exist — and it compares realised drag to its own Gaussian part, so
it can't be fooled by estimator choice.
- LEVERAGE CURVE — drag at 1×/2×/3×, plus break-even L_be = 2μ/σ² and Kelly = μ/σ², shown ONLY as
conditionals on an edge YOU enter. The script never estimates drift, and says why.
READ IT how you like: a familiar 0-100 percentile OSCILLATOR in the pane (cheap<20, expensive>80,
midline 50, like an RSI of holding-cost), or the absolute drag %/yr line. On price, a heat-RIBBON and
green/red regime triangles show cheap→expensive to hold — VOLATILITY regime, direction-agnostic. A red
marker means "expensive, size down", never "go short".
No directional claim and no backtest — there is nothing here to fit. Descriptive risk context, not advice.
Leverage magnifies losses; this shows one cost of it, not all risks.
Notas de prensa
minor changeScript de código abierto
Fiel al espíritu de TradingView, el creador de este script lo ha convertido en código abierto, para que los traders puedan revisar y verificar su funcionalidad. ¡Enhorabuena al autor! Aunque puede utilizarlo de forma gratuita, recuerde que cualquier republicación del código está sujeta a nuestras Normas internas.

Exención de responsabilidad
La información y las publicaciones no constituyen, ni deben considerarse como, asesoramiento o recomendaciones financieras, de inversión, de trading u otro tipo, proporcionadas o respaldadas por TradingView. Obtenga más información en Condiciones de uso.
Script de código abierto
Fiel al espíritu de TradingView, el creador de este script lo ha convertido en código abierto, para que los traders puedan revisar y verificar su funcionalidad. ¡Enhorabuena al autor! Aunque puede utilizarlo de forma gratuita, recuerde que cualquier republicación del código está sujeta a nuestras Normas internas.
Exención de responsabilidad
La información y las publicaciones no constituyen, ni deben considerarse como, asesoramiento o recomendaciones financieras, de inversión, de trading u otro tipo, proporcionadas o respaldadas por TradingView. Obtenga más información en Condiciones de uso.