OPEN-SOURCE SCRIPT
Kaufman Adaptive Channel Trend
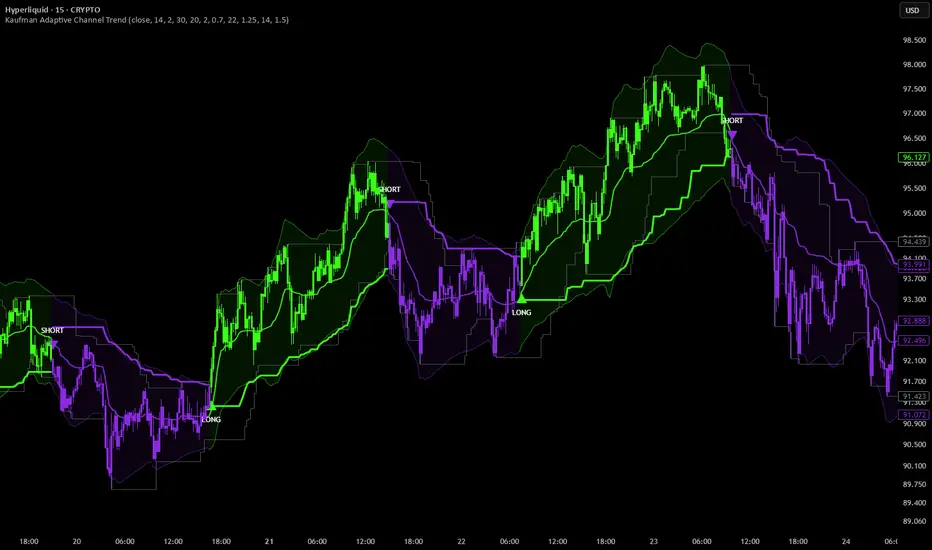
🟣Kaufman Adaptive Channel Trend is an adaptive trend-regime indicator that combines Kaufman's Efficiency Ratio, Kaufman Adaptive Moving Average (KAMA), volatility-based bands, and completed price-channel structure.
The indicator is designed to distinguish efficient directional movement from irregular price behavior and use that distinction to adapt its trend-defense mechanism.
Rather than relying exclusively on a moving average, a fixed volatility multiplier, or a traditional breakout channel, the model continuously adjusts the influence of KAMA-based volatility bands and completed market structure.
The result is a one-way adaptive trend trail that identifies bullish and bearish regimes while responding to changes in directional efficiency.
🟣How It Works
🟣Kaufman Efficiency Ratio
🟣Kaufman Adaptive Moving Average
🟣Adaptive Volatility Bands
🟣Completed Price Channel
🟣Efficiency-Weighted Structural Defense
🟣One-Way Adaptive Trend Trail
🟣Signal Logic
🟣Visual Feedback
🟣Data Window
🟣User Controls
🟣Alerts
🟣What Makes It Different
🟣Intended Use
🟣Limitations
The indicator is designed to distinguish efficient directional movement from irregular price behavior and use that distinction to adapt its trend-defense mechanism.
Rather than relying exclusively on a moving average, a fixed volatility multiplier, or a traditional breakout channel, the model continuously adjusts the influence of KAMA-based volatility bands and completed market structure.
The result is a one-way adaptive trend trail that identifies bullish and bearish regimes while responding to changes in directional efficiency.
🟣How It Works
The indicator combines five primary components:
• Kaufman Efficiency Ratio measures the directional efficiency of price movement.
• KAMA adapts its smoothing response to changing market efficiency.
• Adaptive volatility bands measure price displacement around KAMA.
• A completed price channel identifies broader structural support and resistance.
• An efficiency-weighted trailing mechanism combines these components into a persistent bullish or bearish trend regime.
The interaction between these components allows the indicator to adjust structural defense according to prevailing price conditions rather than applying an identical trailing method in every environment.
🟣Kaufman Efficiency Ratio
Kaufman's Efficiency Ratio evaluates how efficiently price has traveled over a selected observation period.
It compares the absolute net price movement with the accumulated absolute movement between consecutive observations.Pine Script®
The resulting value is constrained between 0 and 1.
• Values closer to 1 indicate relatively efficient directional movement.
• Values closer to 0 indicate greater irregularity or back-and-forth price movement.
The Efficiency Length setting determines the observation horizon used to calculate this measurement.
Efficiency Ratio serves two purposes within the indicator: it controls KAMA's smoothing response and determines the influence assigned to structural price-channel defense.
🟣Kaufman Adaptive Moving Average
KAMA forms the adaptive price baseline.
Its smoothing factor is calculated from the Efficiency Ratio together with configurable fast and slow smoothing lengths.
During efficient directional conditions, the smoothing factor moves toward the faster response.
During less efficient conditions, the smoothing factor moves toward the slower response.
The smoothing constant is squared before being applied recursively to the moving average.
This allows KAMA to respond differently to persistent directional movement and irregular price fluctuations without requiring the user to manually switch moving-average lengths.
🟣Adaptive Volatility Bands
The model estimates price displacement around KAMA using the root mean square of the residual difference between price and the adaptive moving average.
This residual measurement provides a volatility-sensitive distance for the upper and lower bands.
The Band Multiplier controls how strongly the residual displacement affects band width.
A separate ATR-based minimum distance prevents the adaptive bands from becoming narrower than the configured volatility floor.
The resulting upper and lower bands therefore reflect both:
• Price displacement around the adaptive baseline
• A minimum volatility allowance derived from ATR
The bands are displayed as an optional shaded channel around KAMA.
Their primary purpose is to provide a volatility-based component for the adaptive trend-defense calculation.
🟣Completed Price Channel
The indicator calculates an upper and lower price channel from the highest highs and lowest lows over a configurable lookback.
Importantly, the channel references the previous completed calculation rather than allowing the current candle to redefine the structural level being evaluated.
This creates a structural reference based on already established price extremes.
The Channel Length setting determines how much completed price history contributes to these levels.
A shorter lookback produces a more responsive channel, while a longer lookback reflects broader price structure.
The completed channel provides the structural component of the indicator's adaptive defense.
🟣Efficiency-Weighted Structural Defense
The indicator combines two distinct approaches to trend defense:
• KAMA volatility bands
• Completed price-channel structure
The Kaufman Efficiency Ratio determines their relative influence.Pine Script®
When directional efficiency is low, the adaptive defense places greater emphasis on the KAMA volatility bands.
As directional efficiency increases, the completed price channel receives progressively greater influence.
Structure Influence controls how quickly the weighting shifts toward structural defense.
A value of zero removes the channel's influence from the defense calculation, while higher settings allow the completed price structure to become more dominant during efficient market conditions.
This approach enables the model to adapt its trailing reference using the characteristics of price movement rather than relying on one fixed defense mechanism.
🟣One-Way Adaptive Trend Trail
The indicator maintains a persistent bullish or bearish trend regime through a one-way trailing mechanism.
During a bullish regime, the active trail can move higher but cannot move lower.
During a bearish regime, the active trail can move lower but cannot move higher.Pine Script®
This mechanism prevents changes in volatility or structural weighting from loosening an established trend trail.
When the regime reverses, the trail is reinitialized using a configurable ATR-based reset distance.
The reset distance cannot be smaller than the current adaptive band distance.
After initialization, the efficiency-weighted structural defense resumes control of the trail.
This creates a distinction between the initial volatility allowance after a reversal and the subsequent structural progression of the trend.
🟣Signal Logic
LONG and SHORT markers identify changes in the indicator's internal bullish or bearish trend regime.
A reversal occurs when the selected price source crosses the active adaptive structural trail in the opposite direction of the prevailing regime.Pine Script®
A LONG condition requires:
• The previous trend regime to be bearish
• The selected price source to move above the active adaptive structural trail
A SHORT condition requires:
• The previous trend regime to be bullish
• The selected price source to move below the active adaptive structural trail
The active trail combines KAMA volatility bands and completed price-channel structure, with their relative influence determined by Kaufman's Efficiency Ratio.
Once a reversal occurs, the indicator updates its internal trend regime and resets the trail in the direction of the new regime.
The reset distance is determined by the greater of the configured ATR-based reset distance and the current adaptive band distance.
LONG and SHORT markers are displayed only when the internal regime changes, avoiding repeated signals during an uninterrupted bullish or bearish regime.
🟣Visual Feedback
The indicator provides several complementary chart elements.
• KAMA displays the adaptive price baseline.
• Upper and Lower Adaptive Bands display volatility-based price boundaries.
• Adaptive Band Cloud highlights the region between the bands.
• Upper and Lower Price Channels display completed market structure.
• Bullish Trend Trail displays the active bullish structural defense.
• Bearish Trend Trail displays the active bearish structural defense.
• LONG markers identify bullish regime transitions.
• SHORT markers identify bearish regime transitions.
Neon green represents the active bullish trend regime.
Purple represents the active bearish trend regime.
Optional candle coloring applies the same regime colors directly to the price chart.
KAMA, adaptive bands, price channels, trend trails, signal markers, and candle coloring can be displayed or hidden independently.
Disabling these visualization options does not change the underlying calculations or signal logic.
🟣Data Window
The indicator provides additional measurements through TradingView's Data Window:
• Kaufman Efficiency Ratio
• Structural Defense Weight
• Band Distance ATR
• Internal Trend State
Kaufman Efficiency Ratio represents directional efficiency on a normalized scale.
Structural Defense Weight indicates how much influence the completed price channel currently contributes to the adaptive defense.
Band Distance ATR expresses the adaptive band distance relative to current ATR.
Internal Trend State identifies the active bullish or bearish regime numerically.
These values provide additional transparency into how the model adapts to changing market conditions.
🟣User Controls
The indicator includes configurable settings for:
• Price Source
• Efficiency Length
• Fast KAMA Length
• Slow KAMA Length
• Adaptive Band Length
• Band Multiplier
• Minimum Band ATR
• Price Channel Length
• Structure Influence
• ATR Length
• Reset Distance
• KAMA Visibility
• Adaptive Band Visibility
• Price Channel Visibility
• Trend Trail Visibility
• Signal Visibility
• Candle Coloring
• Bullish and Bearish Colors
These settings allow the indicator's smoothing response, structural sensitivity, volatility tolerance, and trend-trail behavior to be adjusted for different instruments and chart timeframes.
🟣Alerts
Separate TradingView alert conditions are provided for:
• Long Signal
• Short Signal
These alerts correspond to transitions into the indicator's bullish or bearish trend regime.
They allow changes in the adaptive trend structure to be monitored through TradingView's alert system.
🟣What Makes It Different
Kaufman Adaptive Channel Trend extends the traditional use of Kaufman's Efficiency Ratio beyond adaptive moving-average smoothing.
The same efficiency measurement that controls KAMA's responsiveness also determines how much influence completed price structure receives within the trend-defense calculation.
This creates a connected framework in which:
• Directional efficiency influences moving-average responsiveness.
• Residual price displacement determines adaptive band geometry.
• ATR establishes a minimum volatility allowance.
• Completed price channels provide structural references.
• Efficiency-dependent weighting combines volatility and structure.
• A one-way trailing mechanism maintains the active trend regime.
The distinctive feature is the interaction between adaptive smoothing, volatility-based defense, and completed market structure.
Rather than treating these measurements as separate indicators that must independently agree, the model combines them into a single adaptive trailing mechanism.
🟣Intended Use
Kaufman Adaptive Channel Trend is designed for trend-regime analysis, structural trend monitoring, and directional market-context assessment.
It can be used to:
• Identify the prevailing bullish or bearish trend regime
• Monitor adaptive structural support and resistance
• Evaluate whether price movement is efficient or irregular
• Observe how structural influence changes with directional efficiency
• Identify potential trend reversals through adaptive trail breaks
• Filter trading decisions according to the prevailing market regime
• Combine directional structure with an existing trading methodology
The indicator can be applied to different financial markets and chart timeframes. Its behavior depends on the instrument, volatility environment, timeframe, and selected parameters.
🟣Limitations
Kaufman Adaptive Channel Trend is a trend-regime indicator and not a complete trading system. LONG and SHORT markers identify changes in the indicator's internal regime and do not imply guaranteed trading outcomes or future performance.
The model depends on price movement, volatility, and completed price-channel structure.
During sideways or irregular market conditions, repeated trail breaks may produce frequent changes in the active trend regime.
Shorter smoothing or channel lengths can increase responsiveness but may also increase sensitivity to short-term price fluctuations.
Longer lengths and wider adaptive bands can reduce sensitivity while increasing the distance required for a trend reversal.
The Efficiency Ratio measures directional efficiency within the selected lookback and should not be interpreted as a probability of future trend continuation.
The adaptive bands represent modeled price displacement and volatility allowances rather than statistically guaranteed price boundaries.
Script de código abierto
Fiel al espíritu de TradingView, el creador de este script lo ha convertido en código abierto, para que los traders puedan revisar y verificar su funcionalidad. ¡Enhorabuena al autor! Aunque puede utilizarlo de forma gratuita, recuerde que cualquier republicación del código está sujeta a nuestras Normas internas.

🟣Crypto market intelligence + Premium indicators & strategies Free trial at schizoquant.com
Exención de responsabilidad
La información y las publicaciones no constituyen, ni deben considerarse como, asesoramiento o recomendaciones financieras, de inversión, de trading u otro tipo, proporcionadas o respaldadas por TradingView. Obtenga más información en Condiciones de uso.
Script de código abierto
Fiel al espíritu de TradingView, el creador de este script lo ha convertido en código abierto, para que los traders puedan revisar y verificar su funcionalidad. ¡Enhorabuena al autor! Aunque puede utilizarlo de forma gratuita, recuerde que cualquier republicación del código está sujeta a nuestras Normas internas.
🟣Crypto market intelligence + Premium indicators & strategies Free trial at schizoquant.com
Exención de responsabilidad
La información y las publicaciones no constituyen, ni deben considerarse como, asesoramiento o recomendaciones financieras, de inversión, de trading u otro tipo, proporcionadas o respaldadas por TradingView. Obtenga más información en Condiciones de uso.