Selecciones de los editoresOPEN-SOURCE SCRIPT
Machine Learning RSI | AI Classification & Ranking (Zeiierman)
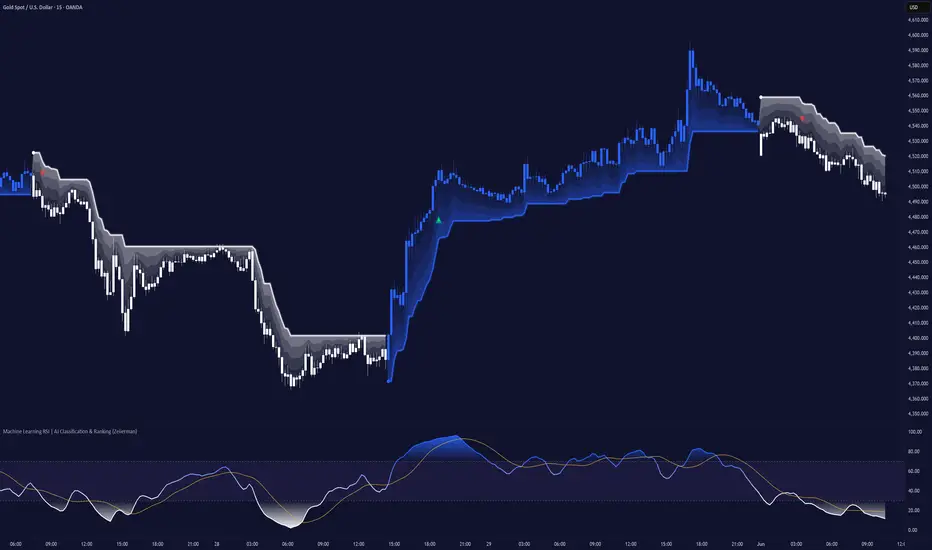
█ Overview
The Machine Learning RSI | AI Classification & Ranking (Zeiierman) is an adaptive RSI intelligence system that combines momentum analysis, historical analog recognition, machine learning classification, confidence scoring, and dynamic trend management into a single framework.
Rather than interpreting RSI solely through traditional overbought and oversold thresholds, the indicator examines how similar RSI environments have behaved historically and uses those observations to classify current market conditions.
The script transforms RSI into a multi-dimensional feature space, stores historical market behavior, identifies the closest historical analogs, and allows those analogs to vote on future directional bias.
An adaptive feature-optimization engine then continuously learns which RSI characteristics provide the greatest predictive value under current market conditions.
The result is a hybrid system that blends:
• Multi-dimensional RSI analysis
• Historical analog matching
• Machine learning classification
• Adaptive feature weighting
• Rank & confidence scoring
• AI-driven trend management

█ Why is this one unique
This is not a normal RSI. It is a full analog classification engine built in Pine Script v6. It turns RSI behavior into an 8-feature market fingerprint, stores historical examples, labels them by future outcome, finds the closest past situations, lets those analogs vote, then converts the result into an adaptive ML RSI, rank/confidence scores, signals, and an ML-modulated Supertrend.
⚪ What it does
⚪ Why it is good
The strongest part is that it combines machine learning logic, technical architecture, and trade-quality filtering into a single system.
Most TradingView indicators are fixed formulas: RSI crosses 30, MACD crosses, Supertrend flips, moving average slope changes. This code differs because it creates a small local learning model directly in Pine.
The unique edge is the combination of:
• Feature engineering: RSI is transformed into 8 separate behavioral dimensions.
• Historical analog learning: Current market conditions are compared to past similar conditions.
• Distance-weighted voting: Closer historical examples have more influence.
• Auto feature weighting: The system adapts which features matter most.
• ATR-based outcome labeling: Learning is normalized by volatility, not just raw price movement.
• Quality scoring: Signals require both rank and confidence.
• Adaptive trend logic: The ML engine not only generates oscillator signals but also modifies Supertrend behavior.
That combination is rare in Pine Script. TradingView supports advanced data structures such as arrays, matrices, and user-defined types, but many public scripts still use simpler procedural indicator logic. This script uses those advanced structures as a true modeling framework.
⚪ What makes it sophisticated
The code actually implements an AI-style classification workflow:
That is a real machine-learning pattern.
But this script goes further than a basic KNN signal tool because it adds:
• Auto-optimized feature weights using class separation.
• Rank/confidence gates instead of raw prediction signals.
• Chop, volatility, and trend filters to reduce bad market conditions.
• ML-driven Supertrend adaptivity rather than using ML only for arrows.
• Non-repainting signal discipline by firing on confirmed bars only.
⚪ Why It’s Marketable
Most RSI indicators treat every reading the same. This tool takes a different approach by analyzing how similar RSI conditions performed in the past and evaluating the current setup against those historical patterns. It only generates signals when multiple factors align, including confidence, trend direction, volatility, and market structure.
What makes it valuable is that it transforms RSI from a simple momentum oscillator into a context-aware decision framework. Rather than reacting to fixed overbought and oversold levels, it identifies recurring market behaviors, measures the similarity of current conditions to historical examples, and assigns a quality score to each opportunity. It then filters out low-probability environments and dynamically adjusts its trend management based on the strength of the model's conviction.
The result is a more selective, adaptive, and intelligent signal engine that helps traders focus on higher-quality setups instead of every RSI fluctuation. This moves well beyond the capabilities of a conventional TradingView RSI indicator.
⚪ Main weakness
It is not deep learning, and it does not train a neural network. It is an online analog classifier. That is still legitimate AI-style logic. Also, because it learns from historical analogs inside the chart, performance depends heavily on market regime, symbol, timeframe, memory depth, and filters.
█ How It Works
⚪ Machine Learning Feature Engine
Most RSI indicators analyze a single value.
The Machine Learning RSI transforms RSI into a complete momentum fingerprint, consisting of eight independent characteristics that describe how momentum behaves beneath the surface.
The model analyzes:
• RSI Value
• RSI Slope
• RSI Acceleration
• Distance From Neutral (50)
• RSI Percentile Rank
• RSI Volatility
• Fast vs Slow RSI Spread
• RSI Regime Structure
Pine Script®
Together these features create a much richer representation of market behavior than traditional RSI calculations.
Instead of asking:
“Where is RSI?”
The model asks:
“What type of momentum behavior is currently occurring?”
⚪ Historical Analog Memory
The indicator continuously builds a memory bank of historical market behavior.
Every confirmed bar is stored together with its RSI fingerprint and the future outcome that followed.
Pine Script®
Over time the model accumulates hundreds or even thousands of historical observations.
Each observation becomes a real market example the system can reference later.
Rather than relying entirely on fixed formulas, the indicator learns from historical market behavior.
⚪ AI Classification Engine
Once the memory bank has been built, the Machine Learning RSI begins searching for historical situations that closely resemble the current market.
The comparison is performed across all eight RSI features simultaneously.
Pine Script®
Similarity is measured using a weighted Lorentzian distance function.
Pine Script®
Unlike traditional distance calculations, logarithmic compression reduces the influence of extreme outliers and prevents a single feature from dominating the comparison process.
This creates a more stable and robust analog matching system.
The objective is not to find identical charts.
The objective is to find historical momentum environments that behaved similarly.
⚪ Historical Analog Voting
After locating the closest historical matches, the system allows them to vote on the current market direction.
Closer analogs receive greater influence while weaker matches contribute less.
Pine Script®
The weighted votes are combined into a final classification score.
Pine Script®
This process produces:
• Directional Bias
• Analog Agreement
• Classification Strength
• Similarity Quality
• Market Conviction
Rather than attempting to predict the future directly, the model asks:
“How did the most similar momentum environments behave when they occurred previously?”
⚪ Adaptive Feature Optimizer
Markets are constantly changing.
Features that are highly predictive in one environment may become less useful in another.
To solve this problem, the Machine Learning RSI includes an adaptive feature optimization engine.
The model continuously evaluates which RSI characteristics are doing the best job separating bullish outcomes from bearish outcomes.
Pine Script®
This process is based on Fisher Discriminant Analysis.
Features that consistently separate winning conditions from losing conditions receive larger weights.
Features that lose predictive power gradually receive less influence.
Pine Script®
This allows the model to adapt automatically to changing market conditions without requiring constant manual optimization.
⚪ Rank & Confidence Engine
Most indicators generate signals immediately after a condition is met.
The Machine Learning RSI goes several steps further. Every setup receives two independent evaluations.
• Rank → Measures setup quality.
• Confidence → Measures model conviction.
Rank evaluates:
• Historical agreement
• Analog quality
• Trend alignment
• Volatility conditions
• Regime structure
• Momentum consistency
• Market stability
Confidence evaluates:
• Historical consensus
• Analog clustering
• Directional consistency
• Signal persistence
• Structural confirmation
Pine Script®
Signals are only generated once both quality and confidence requirements have been satisfied.
This helps filter weaker market conditions while prioritizing stronger opportunities.
⚪ AI-Driven Learning System
The Machine Learning RSI does not simply memorize historical outcomes.
It learns what constitutes a meaningful outcome.
Each historical observation is classified based on future movement relative to current volatility.
Pine Script®
• Large bullish moves receive stronger bullish labels.
• Large bearish moves receive stronger bearish labels.
• Small movements receive weaker classifications.
This allows the model to distinguish meaningful market behavior from ordinary noise.
⚪ ML Supertrend System
The indicator includes an adaptive Machine Learning Supertrend that responds to model conviction.
Unlike traditional Supertrends that rely on a fixed ATR multiplier, the ML Supertrend dynamically adjusts its sensitivity based on classification strength.
Pine Script®
As conviction increases:
• Bands tighten
• Trend changes become faster
• Stops become more responsive
As conviction decreases:
• Bands widen
• Noise tolerance increases
• Whipsaws are reduced
Pine Script®
This creates a trend-following system that adapts to the strength of the model’s conviction rather than relying solely on volatility.
█ How To Use
⚪ Reading The ML RSI
The Machine Learning RSI ranges from 0 to 100.
• Values above 50 suggest bullish momentum conditions dominate the market.

• Values below 50 suggest bearish momentum conditions dominate the market.

• Readings above 70 typically indicate strong bullish conditions, while readings below 30 suggest strong bearish pressure.

⚪ Reading The Signals
The Machine Learning RSI generates signals when the model detects a meaningful shift in market conditions and that shift passes both its quality and confidence requirements.
• Long signals indicate that the classification engine has identified a bullish market environment supported by historical analog agreement, trend structure, and market conditions.
• Short signals indicate that the classification engine has identified a bearish market environment supported by historical analog agreement, trend structure, and market conditions.

⚪ Using The ML Supertrend
The ML Supertrend acts as both a trend filter and a dynamic trailing stop.
• When the Supertrend flips bullish, the model considers the market to be operating in an uptrend regime.
• When the Supertrend flips bearish, the model considers the market to be operating in a downtrend regime.

█ Settings
-----------------
Disclaimer
The content provided in my scripts, indicators, ideas, algorithms, and systems is for educational and informational purposes only. It does not constitute financial advice, investment recommendations, or a solicitation to buy or sell any financial instruments. I will not accept liability for any loss or damage, including without limitation any loss of profit, which may arise directly or indirectly from the use of or reliance on such information.
All investments involve risk, and the past performance of a security, industry, sector, market, financial product, trading strategy, backtest, or individual's trading does not guarantee future results or returns. Investors are fully responsible for any investment decisions they make. Such decisions should be based solely on an evaluation of their financial circumstances, investment objectives, risk tolerance, and liquidity needs.
The Machine Learning RSI | AI Classification & Ranking (Zeiierman) is an adaptive RSI intelligence system that combines momentum analysis, historical analog recognition, machine learning classification, confidence scoring, and dynamic trend management into a single framework.
Rather than interpreting RSI solely through traditional overbought and oversold thresholds, the indicator examines how similar RSI environments have behaved historically and uses those observations to classify current market conditions.
The script transforms RSI into a multi-dimensional feature space, stores historical market behavior, identifies the closest historical analogs, and allows those analogs to vote on future directional bias.
An adaptive feature-optimization engine then continuously learns which RSI characteristics provide the greatest predictive value under current market conditions.
The result is a hybrid system that blends:
• Multi-dimensional RSI analysis
• Historical analog matching
• Machine learning classification
• Adaptive feature weighting
• Rank & confidence scoring
• AI-driven trend management
█ Why is this one unique
This is not a normal RSI. It is a full analog classification engine built in Pine Script v6. It turns RSI behavior into an 8-feature market fingerprint, stores historical examples, labels them by future outcome, finds the closest past situations, lets those analogs vote, then converts the result into an adaptive ML RSI, rank/confidence scores, signals, and an ML-modulated Supertrend.
⚪ What it does
At a high level:
1. Builds 8 RSI-derived features
It does not only use the RSI value. It models:
RSI level, slope, acceleration, distance from 50, percentile rank, RSI volatility, fast/slow RSI spread, and smoothed RSI regime.
That means each bar becomes a multi-dimensional “state” of momentum, not just “RSI is 63.”
2. Creates a memory bank
Each confirmed bar is stored with its feature snapshot and a future outcome label. The label is based on whether price moved up or down after a fixed horizon, scaled by ATR. That is the learning dataset.
3. Uses K-nearest-neighbor analog matching
For the current bar, the script scans the historical bank and finds the closest past examples. It uses a Lorentzian-style compressed distance:Pine Script®
That is good because it reduces the impact of outliers. Huge feature mismatches do not completely dominate the model.
4. Lets analogs vote
Nearest neighbors vote bull or bear, weighted by distance. Closer matches matter more. The output becomes: analogScore, bias direction, agreement fraction, and gap tightness.
5. Auto-optimizes feature weights
This is one of the most sophisticated parts. The script uses a Fisher-discriminant-style calculation to determine which RSI features currently best separate bullish vs. bearish outcomes. Then it rescales those weights and smooths them over time.
So the model can learn that, for example, RSI slope matters more on one instrument, while RSI percentile or regime matters more on another.
6. Builds rank and confidence
Signals are not triggered just because the model flips bullish or bearish. They must pass a quality system:
Rank blends agreement, distance tightness, trend alignment, volatility health, regime fit, slope fit, smoothness, persistence, and penalties for chop or early flips.
Confidence focuses more on analog agreement, tightness, persistence, and slope fit.
This is much better than a simple buy/sell oscillator because it asks: “Is this setup actually supported?”
7. Adds adaptive Supertrend
The Supertrend is not static. Its band width changes based on ML conviction. High conviction tightens the trailing stop. Low conviction or chop widens it. That makes the trend system responsive without being blindly reactive.
⚪ Why it is good
The strongest part is that it combines machine learning logic, technical architecture, and trade-quality filtering into a single system.
Most TradingView indicators are fixed formulas: RSI crosses 30, MACD crosses, Supertrend flips, moving average slope changes. This code differs because it creates a small local learning model directly in Pine.
The unique edge is the combination of:
• Feature engineering: RSI is transformed into 8 separate behavioral dimensions.
• Historical analog learning: Current market conditions are compared to past similar conditions.
• Distance-weighted voting: Closer historical examples have more influence.
• Auto feature weighting: The system adapts which features matter most.
• ATR-based outcome labeling: Learning is normalized by volatility, not just raw price movement.
• Quality scoring: Signals require both rank and confidence.
• Adaptive trend logic: The ML engine not only generates oscillator signals but also modifies Supertrend behavior.
That combination is rare in Pine Script. TradingView supports advanced data structures such as arrays, matrices, and user-defined types, but many public scripts still use simpler procedural indicator logic. This script uses those advanced structures as a true modeling framework.
⚪ What makes it sophisticated
The code actually implements an AI-style classification workflow:
Input features → labeled memory → nearest-neighbor search → weighted classification → confidence scoring → adaptive output.
That is a real machine-learning pattern.
But this script goes further than a basic KNN signal tool because it adds:
• Auto-optimized feature weights using class separation.
• Rank/confidence gates instead of raw prediction signals.
• Chop, volatility, and trend filters to reduce bad market conditions.
• ML-driven Supertrend adaptivity rather than using ML only for arrows.
• Non-repainting signal discipline by firing on confirmed bars only.
⚪ Why It’s Marketable
Most RSI indicators treat every reading the same. This tool takes a different approach by analyzing how similar RSI conditions performed in the past and evaluating the current setup against those historical patterns. It only generates signals when multiple factors align, including confidence, trend direction, volatility, and market structure.
What makes it valuable is that it transforms RSI from a simple momentum oscillator into a context-aware decision framework. Rather than reacting to fixed overbought and oversold levels, it identifies recurring market behaviors, measures the similarity of current conditions to historical examples, and assigns a quality score to each opportunity. It then filters out low-probability environments and dynamically adjusts its trend management based on the strength of the model's conviction.
The result is a more selective, adaptive, and intelligent signal engine that helps traders focus on higher-quality setups instead of every RSI fluctuation. This moves well beyond the capabilities of a conventional TradingView RSI indicator.
⚪ Main weakness
It is not deep learning, and it does not train a neural network. It is an online analog classifier. That is still legitimate AI-style logic. Also, because it learns from historical analogs inside the chart, performance depends heavily on market regime, symbol, timeframe, memory depth, and filters.
█ How It Works
⚪ Machine Learning Feature Engine
Most RSI indicators analyze a single value.
The Machine Learning RSI transforms RSI into a complete momentum fingerprint, consisting of eight independent characteristics that describe how momentum behaves beneath the surface.
The model analyzes:
• RSI Value
• RSI Slope
• RSI Acceleration
• Distance From Neutral (50)
• RSI Percentile Rank
• RSI Volatility
• Fast vs Slow RSI Spread
• RSI Regime Structure
Together these features create a much richer representation of market behavior than traditional RSI calculations.
Instead of asking:
“Where is RSI?”
The model asks:
“What type of momentum behavior is currently occurring?”
⚪ Historical Analog Memory
The indicator continuously builds a memory bank of historical market behavior.
Every confirmed bar is stored together with its RSI fingerprint and the future outcome that followed.
Over time the model accumulates hundreds or even thousands of historical observations.
Each observation becomes a real market example the system can reference later.
Rather than relying entirely on fixed formulas, the indicator learns from historical market behavior.
⚪ AI Classification Engine
Once the memory bank has been built, the Machine Learning RSI begins searching for historical situations that closely resemble the current market.
The comparison is performed across all eight RSI features simultaneously.
Similarity is measured using a weighted Lorentzian distance function.
Unlike traditional distance calculations, logarithmic compression reduces the influence of extreme outliers and prevents a single feature from dominating the comparison process.
This creates a more stable and robust analog matching system.
The objective is not to find identical charts.
The objective is to find historical momentum environments that behaved similarly.
⚪ Historical Analog Voting
After locating the closest historical matches, the system allows them to vote on the current market direction.
Closer analogs receive greater influence while weaker matches contribute less.
The weighted votes are combined into a final classification score.
This process produces:
• Directional Bias
• Analog Agreement
• Classification Strength
• Similarity Quality
• Market Conviction
Rather than attempting to predict the future directly, the model asks:
“How did the most similar momentum environments behave when they occurred previously?”
⚪ Adaptive Feature Optimizer
Markets are constantly changing.
Features that are highly predictive in one environment may become less useful in another.
To solve this problem, the Machine Learning RSI includes an adaptive feature optimization engine.
The model continuously evaluates which RSI characteristics are doing the best job separating bullish outcomes from bearish outcomes.
This process is based on Fisher Discriminant Analysis.
Features that consistently separate winning conditions from losing conditions receive larger weights.
Features that lose predictive power gradually receive less influence.
This allows the model to adapt automatically to changing market conditions without requiring constant manual optimization.
⚪ Rank & Confidence Engine
Most indicators generate signals immediately after a condition is met.
The Machine Learning RSI goes several steps further. Every setup receives two independent evaluations.
• Rank → Measures setup quality.
• Confidence → Measures model conviction.
Rank evaluates:
• Historical agreement
• Analog quality
• Trend alignment
• Volatility conditions
• Regime structure
• Momentum consistency
• Market stability
Confidence evaluates:
• Historical consensus
• Analog clustering
• Directional consistency
• Signal persistence
• Structural confirmation
Signals are only generated once both quality and confidence requirements have been satisfied.
This helps filter weaker market conditions while prioritizing stronger opportunities.
⚪ AI-Driven Learning System
The Machine Learning RSI does not simply memorize historical outcomes.
It learns what constitutes a meaningful outcome.
Each historical observation is classified based on future movement relative to current volatility.
• Large bullish moves receive stronger bullish labels.
• Large bearish moves receive stronger bearish labels.
• Small movements receive weaker classifications.
This allows the model to distinguish meaningful market behavior from ordinary noise.
⚪ ML Supertrend System
The indicator includes an adaptive Machine Learning Supertrend that responds to model conviction.
Unlike traditional Supertrends that rely on a fixed ATR multiplier, the ML Supertrend dynamically adjusts its sensitivity based on classification strength.
As conviction increases:
• Bands tighten
• Trend changes become faster
• Stops become more responsive
As conviction decreases:
• Bands widen
• Noise tolerance increases
• Whipsaws are reduced
This creates a trend-following system that adapts to the strength of the model’s conviction rather than relying solely on volatility.
█ How To Use
⚪ Reading The ML RSI
The Machine Learning RSI ranges from 0 to 100.
• Values above 50 suggest bullish momentum conditions dominate the market.
• Values below 50 suggest bearish momentum conditions dominate the market.
• Readings above 70 typically indicate strong bullish conditions, while readings below 30 suggest strong bearish pressure.
⚪ Reading The Signals
The Machine Learning RSI generates signals when the model detects a meaningful shift in market conditions and that shift passes both its quality and confidence requirements.
• Long signals indicate that the classification engine has identified a bullish market environment supported by historical analog agreement, trend structure, and market conditions.
• Short signals indicate that the classification engine has identified a bearish market environment supported by historical analog agreement, trend structure, and market conditions.
⚪ Using The ML Supertrend
The ML Supertrend acts as both a trend filter and a dynamic trailing stop.
• When the Supertrend flips bullish, the model considers the market to be operating in an uptrend regime.
• When the Supertrend flips bearish, the model considers the market to be operating in a downtrend regime.
█ Settings
- Price Source: controls the price data used to build every RSI feature inside the learning engine.
- Base RSI Length: controls the main RSI period used to create the ML RSI and its feature set.
- Memory Depth: controls how many historical bars the model stores and searches when looking for similar market conditions.
- Analog Count (k): controls how many closest historical matches are allowed to vote on the current market direction.
- Show Signal Markers: toggles the Long and Short signal markers on the chart.
- Candle Coloring: colors candles based on the current ML Supertrend regime.
- Min Rank to Signal: controls the minimum setup-quality score required before a signal can appear.
- Min Confidence to Signal: controls the minimum model conviction required before a signal can appear.
- Trend Gate: requires signals to align with the ML Supertrend direction.
- Volatility Band: filters signals so they only appear in healthier volatility conditions.
- Min Vol Rank: controls the lower volatility threshold required for signals.
- Chop Filter: blocks signals during choppy, range-bound market conditions.
- Learning Sensitivity: controls how large a future move must be before the model treats it as a meaningful historical outcome.
- Auto-Optimize Weights: allows the model to automatically learn which RSI features are most important.
- Adaptation Speed: controls how quickly the learned feature weights adjust to changing market behavior.
- Feature Weights: manually control the importance of each RSI feature when Auto-Optimize Weights is disabled.
- Show ML Supertrend: toggles the adaptive ML Supertrend line, cloud, and trend visuals.
- Supertrend Source: controls the price source used to build the ML Supertrend bands.
- ATR Multiplier: controls the base distance of the ML Supertrend from price.
- ML Band Adaptivity: controls how strongly model conviction adjusts the Supertrend band width.
- RSI Signal Line Type: selects the moving average style displayed on the ML RSI.
- RSI Signal Line Length: controls the smoothing length of the RSI signal line.
- BB StdDev: controls the Bollinger Band width when using SMA + Bollinger Bands.
- Colors: customize signal markers, candle coloring, ML RSI colors, Supertrend colors, cloud colors, and signal line visuals.
-----------------
Disclaimer
The content provided in my scripts, indicators, ideas, algorithms, and systems is for educational and informational purposes only. It does not constitute financial advice, investment recommendations, or a solicitation to buy or sell any financial instruments. I will not accept liability for any loss or damage, including without limitation any loss of profit, which may arise directly or indirectly from the use of or reliance on such information.
All investments involve risk, and the past performance of a security, industry, sector, market, financial product, trading strategy, backtest, or individual's trading does not guarantee future results or returns. Investors are fully responsible for any investment decisions they make. Such decisions should be based solely on an evaluation of their financial circumstances, investment objectives, risk tolerance, and liquidity needs.
Script de código abierto
Fiel al espíritu de TradingView, el creador de este script lo ha convertido en código abierto, para que los traders puedan revisar y verificar su funcionalidad. ¡Enhorabuena al autor! Aunque puede utilizarlo de forma gratuita, recuerde que cualquier republicación del código está sujeta a nuestras Normas internas.

Access my indicators at: zeiierman.com
Join Our Free Discord: discord.gg/zeiiermantrading
Join Our Free Discord: discord.gg/zeiiermantrading
Exención de responsabilidad
La información y las publicaciones no constituyen, ni deben considerarse como, asesoramiento o recomendaciones financieras, de inversión, de trading u otro tipo, proporcionadas o respaldadas por TradingView. Obtenga más información en Condiciones de uso.
Script de código abierto
Fiel al espíritu de TradingView, el creador de este script lo ha convertido en código abierto, para que los traders puedan revisar y verificar su funcionalidad. ¡Enhorabuena al autor! Aunque puede utilizarlo de forma gratuita, recuerde que cualquier republicación del código está sujeta a nuestras Normas internas.
Access my indicators at: zeiierman.com
Join Our Free Discord: discord.gg/zeiiermantrading
Join Our Free Discord: discord.gg/zeiiermantrading
Exención de responsabilidad
La información y las publicaciones no constituyen, ni deben considerarse como, asesoramiento o recomendaciones financieras, de inversión, de trading u otro tipo, proporcionadas o respaldadas por TradingView. Obtenga más información en Condiciones de uso.