Chart Pattern Structure
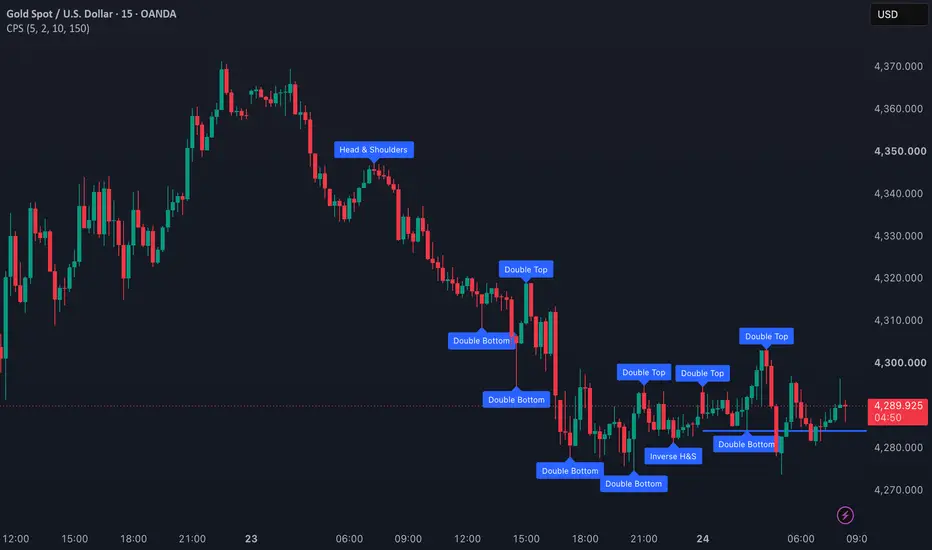
Chart Pattern Structure detects classic chart patterns by analyzing confirmed swing highs and swing lows rather than relying on simple visual pattern matching.
The indicator identifies Double Top, Double Bottom, Head & Shoulders, and Inverse Head & Shoulders structures based on swing sequence, price similarity, and pattern width. Detected patterns are displayed directly on the chart with their underlying swing structure and neckline.
The goal is to provide a clearer structural view of how a chart pattern develops, helping traders study potential formations and their key structural levels without turning the pattern itself into an automatic trading signal.
Pattern detection uses confirmed pivots, so newly forming swings are only recognized after sufficient price action has developed. This helps keep the structure more consistent and avoids treating every temporary price fluctuation as a completed pattern.
Disclaimer:
For educational and informational purposes only. Detected patterns are based on historical price action and do not guarantee future market movements or trading results. Not financial advice.
The indicator identifies Double Top, Double Bottom, Head & Shoulders, and Inverse Head & Shoulders structures based on swing sequence, price similarity, and pattern width. Detected patterns are displayed directly on the chart with their underlying swing structure and neckline.
The goal is to provide a clearer structural view of how a chart pattern develops, helping traders study potential formations and their key structural levels without turning the pattern itself into an automatic trading signal.
Pattern detection uses confirmed pivots, so newly forming swings are only recognized after sufficient price action has developed. This helps keep the structure more consistent and avoids treating every temporary price fluctuation as a completed pattern.
Disclaimer:
For educational and informational purposes only. Detected patterns are based on historical price action and do not guarantee future market movements or trading results. Not financial advice.

Exención de responsabilidad
La información y las publicaciones no constituyen, ni deben considerarse como, asesoramiento o recomendaciones financieras, de inversión, de trading u otro tipo, proporcionadas o respaldadas por TradingView. Obtenga más información en Condiciones de uso.
Exención de responsabilidad
La información y las publicaciones no constituyen, ni deben considerarse como, asesoramiento o recomendaciones financieras, de inversión, de trading u otro tipo, proporcionadas o respaldadas por TradingView. Obtenga más información en Condiciones de uso.