OPEN-SOURCE SCRIPT
Micro Momentum Oscillator [DYNA]
Micro Momentum Oscillator is a purpose-built momentum tool for scalpers who need to know the instant short-term momentum shifts direction. It doesn't just tell you whether RSI is high or low -- it measures how fast RSI is changing and fires a signal the moment that rate of change flips in an extreme zone.
Most oscillators lag behind price on micro timeframes. By the time a standard RSI or MACD prints a crossover on a 1-minute chart, the move is already half over. Micro Momentum Oscillator solves this by applying a rate-of-change calculation directly to RSI and smoothing the result with a weighted moving average. The output is a fast, responsive line that turns teal when momentum is accelerating upward and red when it is accelerating downward -- giving you a clean visual read on who is in control right now.
Key Features
How It Works
The oscillator computes a short-period RSI (default 5), then calculates the rate of change of that RSI over the last 3 bars. This raw ROC is smoothed with a 3-period weighted moving average to filter out single-bar noise while keeping the reading fast.
The result is plotted as a line that oscillates around zero. When the line is above zero and teal, momentum is pushing RSI higher -- buyers are gaining strength. When the line is below zero and red, momentum is dragging RSI lower -- sellers are in control.
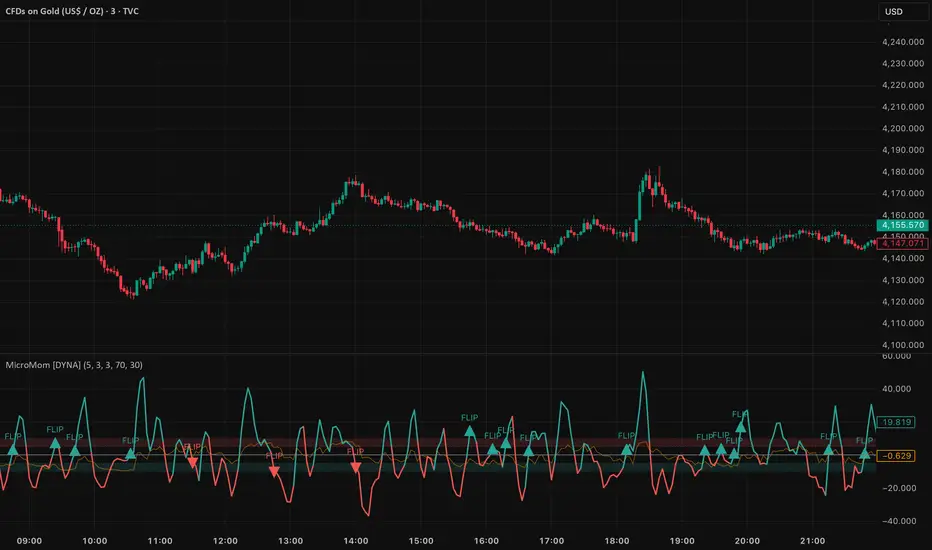
The key signal is the momentum flip. When the oscillator crosses above zero and RSI was recently in the oversold zone (below 30), a bullish FLIP marker appears. When it crosses below zero and RSI was in the overbought zone (above 70), a bearish FLIP marker appears. These flips highlight the moments when exhausted momentum reverses direction at an extreme -- exactly the kind of micro-reversal scalpers look for.

Micro Momentum Oscillator on a 1-minute BTC chart showing bullish and bearish flip signals at momentum extremes.
Visual Elements
The oscillator pane shows a teal/red momentum line, a gray zero line, and soft zone shading in the overbought and oversold areas. A thin orange reference line tracks the underlying RSI (scaled to fit the pane) so you can see at a glance whether price is stretched. Triangle markers with "FLIP" text appear at momentum reversal points in extreme zones.

Zone shading highlights overbought and oversold momentum areas. The orange RSI reference line shows underlying conditions.
Settings
The core settings control the speed of the oscillator. RSI Length (default 5) sets the underlying RSI period -- lower values make it more reactive. ROC Length (default 3) controls how many bars of RSI change are measured. Smoothing (default 3) applies a WMA to the ROC output to remove noise without adding significant lag.
Overbought and Oversold levels (default 70 and 30) define the RSI thresholds for flip detection. Only momentum reversals that occur when RSI was beyond these levels generate flip markers. You can tighten these thresholds (e.g., 75/25) for fewer but higher-conviction signals, or widen them (e.g., 65/35) for more frequent signals.
Visual toggles let you show or hide zone shading and flip markers. Alert toggles let you enable or disable each alert type independently.
Alerts
To set up alerts: click the TradingView Alerts button, select "Micro Momentum Oscillator [DYNA]" from the indicator dropdown, choose "Any alert() function call" as the condition, and set your preferred notification method.
Best Practices
Part of the DYNA Ecosystem
Micro Momentum Oscillator is a free indicator built with the same design standards as the DYNA premium suite. For complete trade management with automatic stop loss, break-even, trailing stops, and multi-target systems, explore the full DYNA indicator collection.
Disclaimer
This indicator is a technical analysis and educational tool only -- it is not financial advice and makes no guarantee of any outcome. Past performance does not predict future results. Always do your own research and use proper position sizing and risk management.
Created by Varun Nidhi · varunnidhi.com
A free DYNA indicator — self-contained, no repainting.
Most oscillators lag behind price on micro timeframes. By the time a standard RSI or MACD prints a crossover on a 1-minute chart, the move is already half over. Micro Momentum Oscillator solves this by applying a rate-of-change calculation directly to RSI and smoothing the result with a weighted moving average. The output is a fast, responsive line that turns teal when momentum is accelerating upward and red when it is accelerating downward -- giving you a clean visual read on who is in control right now.
Key Features
- RSI Rate-of-Change Pipeline -- Measures how quickly RSI itself is changing, not just its level. This catches momentum shifts before the RSI line visually turns.
- OB/OS Zone Flip Detection -- Signals only fire when momentum flips direction while RSI was in an extreme zone (oversold or overbought), filtering out noise in the middle range.
- Color-Coded Momentum Line -- Teal for bullish acceleration, red for bearish acceleration. No interpretation needed -- the color tells you the direction at a glance.
- Zone Shading -- Soft red and teal fills in the overbought and oversold momentum zones so you can instantly see when the oscillator is in an extreme area.
- Confirmed-Bar Logic -- All signals reference the previous bar's values, so flip markers never repaint or disappear after they print.
How It Works
The oscillator computes a short-period RSI (default 5), then calculates the rate of change of that RSI over the last 3 bars. This raw ROC is smoothed with a 3-period weighted moving average to filter out single-bar noise while keeping the reading fast.
The result is plotted as a line that oscillates around zero. When the line is above zero and teal, momentum is pushing RSI higher -- buyers are gaining strength. When the line is below zero and red, momentum is dragging RSI lower -- sellers are in control.
The key signal is the momentum flip. When the oscillator crosses above zero and RSI was recently in the oversold zone (below 30), a bullish FLIP marker appears. When it crosses below zero and RSI was in the overbought zone (above 70), a bearish FLIP marker appears. These flips highlight the moments when exhausted momentum reverses direction at an extreme -- exactly the kind of micro-reversal scalpers look for.
Micro Momentum Oscillator on a 1-minute BTC chart showing bullish and bearish flip signals at momentum extremes.
Visual Elements
The oscillator pane shows a teal/red momentum line, a gray zero line, and soft zone shading in the overbought and oversold areas. A thin orange reference line tracks the underlying RSI (scaled to fit the pane) so you can see at a glance whether price is stretched. Triangle markers with "FLIP" text appear at momentum reversal points in extreme zones.
Zone shading highlights overbought and oversold momentum areas. The orange RSI reference line shows underlying conditions.
Settings
The core settings control the speed of the oscillator. RSI Length (default 5) sets the underlying RSI period -- lower values make it more reactive. ROC Length (default 3) controls how many bars of RSI change are measured. Smoothing (default 3) applies a WMA to the ROC output to remove noise without adding significant lag.
Overbought and Oversold levels (default 70 and 30) define the RSI thresholds for flip detection. Only momentum reversals that occur when RSI was beyond these levels generate flip markers. You can tighten these thresholds (e.g., 75/25) for fewer but higher-conviction signals, or widen them (e.g., 65/35) for more frequent signals.
Visual toggles let you show or hide zone shading and flip markers. Alert toggles let you enable or disable each alert type independently.
Alerts
- Momentum Flip Bullish -- Fires when the smoothed ROC crosses above zero while RSI was in the oversold zone. "Micro Momentum Oscillator [DYNA]: Bullish momentum flip detected. RSI was oversold, ROC now accelerating upward."
- Momentum Flip Bearish -- Fires when the smoothed ROC crosses below zero while RSI was in the overbought zone. "Micro Momentum Oscillator [DYNA]: Bearish momentum flip detected. RSI was overbought, ROC now decelerating downward."
To set up alerts: click the TradingView Alerts button, select "Micro Momentum Oscillator [DYNA]" from the indicator dropdown, choose "Any alert() function call" as the condition, and set your preferred notification method.
Best Practices
- Use on 1-3 minute charts for best results. The default parameters are calibrated for micro-timeframe scalping.
- Treat FLIP signals as timing cues, not standalone entries. Confirm with a supporting candle pattern, a volume spike, or a key support/resistance level.
- Avoid trading flips during low-volume periods such as pre-market or lunch hours when momentum readings become noisy.
- If moving to 5-minute charts, consider increasing RSI Length to 8-10 to maintain signal quality.
- Pair with a volume indicator or tape reader for stronger confirmation on each flip.
Part of the DYNA Ecosystem
Micro Momentum Oscillator is a free indicator built with the same design standards as the DYNA premium suite. For complete trade management with automatic stop loss, break-even, trailing stops, and multi-target systems, explore the full DYNA indicator collection.
Disclaimer
This indicator is a technical analysis and educational tool only -- it is not financial advice and makes no guarantee of any outcome. Past performance does not predict future results. Always do your own research and use proper position sizing and risk management.
Created by Varun Nidhi · varunnidhi.com
A free DYNA indicator — self-contained, no repainting.
Script de código abierto
Fiel al espíritu de TradingView, el creador de este script lo ha convertido en código abierto, para que los traders puedan revisar y verificar su funcionalidad. ¡Enhorabuena al autor! Aunque puede utilizarlo de forma gratuita, recuerde que cualquier republicación del código está sujeta a nuestras Normas internas.

Exención de responsabilidad
La información y las publicaciones no constituyen, ni deben considerarse como, asesoramiento o recomendaciones financieras, de inversión, de trading u otro tipo, proporcionadas o respaldadas por TradingView. Obtenga más información en Condiciones de uso.
Script de código abierto
Fiel al espíritu de TradingView, el creador de este script lo ha convertido en código abierto, para que los traders puedan revisar y verificar su funcionalidad. ¡Enhorabuena al autor! Aunque puede utilizarlo de forma gratuita, recuerde que cualquier republicación del código está sujeta a nuestras Normas internas.
Exención de responsabilidad
La información y las publicaciones no constituyen, ni deben considerarse como, asesoramiento o recomendaciones financieras, de inversión, de trading u otro tipo, proporcionadas o respaldadas por TradingView. Obtenga más información en Condiciones de uso.