OPEN-SOURCE SCRIPT
Actualizado CVD with Moving Average (Trend Colors) [SYNC & TRADE]
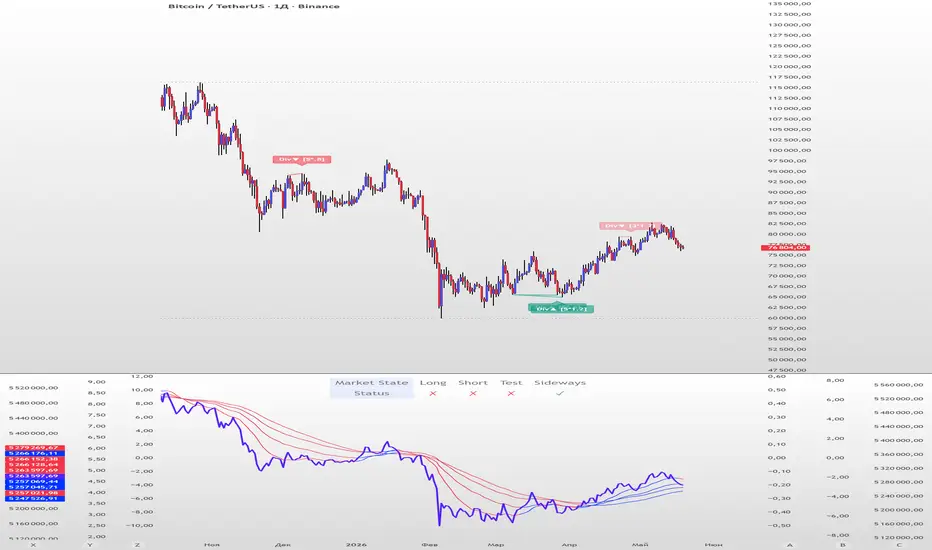
Yesterday I wrote a simple and easy code for the indicator "Cumulative Delta Volume with a moving average" using AI.
Introduction:
Delta is the difference between buys and sells. If there are more purchases, the delta is positive, if there are more sales, the delta is negative. We look at each candle separately on a particular time frame, which does not give us an overall picture over time.
Cumulative volume delta is in many ways an extension of volume delta, but it covers longer periods of time and provides different trading signals. Like the volume delta indicator, the Cumulative Volume Delta (CVD) indicator measures the relationship between buying and selling pressure, but does not focus on one specific candle (or other chart element), but rather gives a picture over time.
What did you want to get?
I have often seen that they tried to attach RSI and the Ichimoku cloud to the cumulative delta of volume, but I have never seen a cumulative delta of volume with a moving average. A moving average that takes data from the cumulative volume delta will be different from the moving average of the underlying asset. It has been noted that often at the intersection of the cumulative volume delta and the moving average, this is a more accurate signal to buy or sell than the same intersections for the underlying asset.
Initially, 5 moving averages were made with values of 21, 55, 89, 144 and 233, but I realized that this overloads the chart. It is easier to change the length of the moving average depending on the time frame you are using than to overload the chart. The final version with one moving SMA, EMA, RMA, WMA, HMA.
The logic for applying a moving average to a cumulative volume delta:
You choose a moving average, just like you would on your underlying asset. Use the moving average you like and the period you are used to working with. Each TF has its own settings.
What we see on the graph:
This is not an oscillator, but an adapted version for a candlestick chart (line only). Using it, you can clearly see where the market is moving based on the cumulative volume delta. The cool thing is that you can include your moving average applied to the cumulative volume delta. Thanks to this, you can see a trend movement, a return to the moving average to continue the trend.
Opportunities not lost:
The most interesting thing is that it remains possible to observe the divergence of the asset and the cumulative delta of the volume. This gives a great advantage. Those who have not worked with divergence do not rush into it right away. There may be 3 peaks in divergence (as with oversold/overbought), but it works many times more clearly than RSI and MACD.
Here's a good example on the daily chart. The moment we were all waiting for 75,000. The cumulative Delta Volume fell with each peak, while the price chart (tops) were approximately level.

Usually they throw (allow to buy) without volume for sales (delta down, price up) in order to merge at a more interesting price. And they also drain without the volume of purchases for a squeeze (price down / delta up) and again I buy back at a more interesting price. There are more complex estimation options; you can read about the divergence of the cumulative delta of the CVD volume. I just recommend doing a backtest.
Recommendations:
One more moment. Use the indicator on the stock exchange, where there is the most money, by turnover and by asset. Choose Binance, not Bybit. Those. choose the BTC asset, for example, but on the Binance exchange. Not futures, but spot.
The greater the turnover on the exchange for an asset, and the fewer opportunities to enter with leverage, the less volatile the price and the more beautiful and accurate the chart.
Works on all assets. There is a subscription limit (the number of calculated bars) that has little effect on anything. Can be applied to any asset where there is volume (not SPX, but ES1, not MOEX, but MX1!).
Перевод на русский.
Вчера написал с помощью AI простой и легкий код индикатора "Кумулятивная Дельта Объема со скользящей средней".
Введение:
Дельта (Delta) — это разница между покупками и продажами. Если покупок больше — дельта положительная, если больше продаж — дельта отрицательная. Мы смотрим на каждую свечу отдельно на том или ином таймфрейме, что не дает нам общей картины во времени.
Кумулятивная дельта объема — во многом продолжение дельты объёмов, но она включает более длительные периоды времени и дает другие торговые сигналы. Как и индикатор дельты объёма, индикатор кумулятивной дельты объема (Cumulative Volume Delta, CVD) измеряет связь между давлением покупателей и продавцов, но при этом не фокусируется на одной конкретной свече (или другом элементе графика), а дает картину во времени.
Что хотел получить?
Часто видел, что к кумулятивной детьте объема пытались прикрепить RSI и облако ишимоку, но никогда не видел кумулятивную дельту объема со скользящей средней. Скользящая средняя которая берет данные от кумулятивной дельты объема будет отличатся от скользящей средней основного актива. Было замечено, что часто в местах пересечения кумулятивной дельты объема и скользящей средней - это более точный сигнал к покупке или продаже, чем такие же пересечения по основному активу.
Изначально было сделанно 5 скользящих со значениями 21, 55, 89, 144 и 233, но я понял, что это перегружает график. Проще менять длину скользящей средней от используемого таймфрейма, чем перегружать график. Финальный вариант с одной скользящей SMA, EMA, RMA, WMA, HMA.
Логика применения скользящей средней к кумулятивной дельте объема:
Вы выбираете скользящую среднюю, так же как и на основном активе. Применяйте ту скользящую среднюю, которая вам нравится и период, с которым привыкли работать. На каждом TF свои настройки.
Что мы видим на графике:
Это не осциллятор, а адаптированная версия к свечному графику (только линия). С помощью него вы можете наглядно посмотреть куда движется рынок по кумулятивной дельте объема. Самое интересное, что вы можете включить свою скользящую среднюю, применимую к кумулятивной дельте объема. Благодаря этому вы можете видеть трендовое движение, возврат к средней скользящей для продолжения тренда.
Не потерянные возможности:
Самое интересное, что осталась возможность наблюдать за дивергенцией актива и кумулятивной дельтой объема. Это дает большое преимущество. Те кто не работал с дивергенцией не бросайтесь на нее сразу. Может быть и 3 пика в дивергенции (как с перепроданностью / перекупленностью), но работает в разы четче чем RSI и MACD.
Вот хороший пример на дневном графике. Момент когда мы все ждали 75000. Кумулятивная Дельта Объема падала с каждым пиком, в то время как ценовой график (вершины) были примерно на уровне.
Обычно закидывают (разрешают покупать) без объема на продажи (дельта вниз цена вверх), чтобы слить по более интересной цене. И также сливают без объема покупок для сквиза (цена вниз / дельта вверх) и опять откупаю по более интересной цене. Существуют более сложные варианты оценки, можете почитать про дивергенцию кумулятивной дельты объема CVD. Только рекомендую сделать бэктест.
Рекомендации:
Еще момент. Используйте индикатор, на бирже, там где больше всего денег, по обороту и по активу. Выбирайте не Bybit, а Binance. Т.е. выбираете актив BTC, к примеру, но на бирже Binance. Не фьючерс, а спот.
Чем более большие обороты на бирже, по активу, и меньше возможностей заходить с плечами, тем менее волатильная цена и более красивый и точный график.
Работает на всех активах. Есть ограничение по подписке (количество рассчитываемых баров) мало влияет на что. Можно применить к любому активу где есть объем (не SPX, а ES1, не MOEX, а MX1!).
Introduction:
Delta is the difference between buys and sells. If there are more purchases, the delta is positive, if there are more sales, the delta is negative. We look at each candle separately on a particular time frame, which does not give us an overall picture over time.
Cumulative volume delta is in many ways an extension of volume delta, but it covers longer periods of time and provides different trading signals. Like the volume delta indicator, the Cumulative Volume Delta (CVD) indicator measures the relationship between buying and selling pressure, but does not focus on one specific candle (or other chart element), but rather gives a picture over time.
What did you want to get?
I have often seen that they tried to attach RSI and the Ichimoku cloud to the cumulative delta of volume, but I have never seen a cumulative delta of volume with a moving average. A moving average that takes data from the cumulative volume delta will be different from the moving average of the underlying asset. It has been noted that often at the intersection of the cumulative volume delta and the moving average, this is a more accurate signal to buy or sell than the same intersections for the underlying asset.
Initially, 5 moving averages were made with values of 21, 55, 89, 144 and 233, but I realized that this overloads the chart. It is easier to change the length of the moving average depending on the time frame you are using than to overload the chart. The final version with one moving SMA, EMA, RMA, WMA, HMA.
The logic for applying a moving average to a cumulative volume delta:
You choose a moving average, just like you would on your underlying asset. Use the moving average you like and the period you are used to working with. Each TF has its own settings.
What we see on the graph:
This is not an oscillator, but an adapted version for a candlestick chart (line only). Using it, you can clearly see where the market is moving based on the cumulative volume delta. The cool thing is that you can include your moving average applied to the cumulative volume delta. Thanks to this, you can see a trend movement, a return to the moving average to continue the trend.
Opportunities not lost:
The most interesting thing is that it remains possible to observe the divergence of the asset and the cumulative delta of the volume. This gives a great advantage. Those who have not worked with divergence do not rush into it right away. There may be 3 peaks in divergence (as with oversold/overbought), but it works many times more clearly than RSI and MACD.
Here's a good example on the daily chart. The moment we were all waiting for 75,000. The cumulative Delta Volume fell with each peak, while the price chart (tops) were approximately level.
Usually they throw (allow to buy) without volume for sales (delta down, price up) in order to merge at a more interesting price. And they also drain without the volume of purchases for a squeeze (price down / delta up) and again I buy back at a more interesting price. There are more complex estimation options; you can read about the divergence of the cumulative delta of the CVD volume. I just recommend doing a backtest.
Recommendations:
One more moment. Use the indicator on the stock exchange, where there is the most money, by turnover and by asset. Choose Binance, not Bybit. Those. choose the BTC asset, for example, but on the Binance exchange. Not futures, but spot.
The greater the turnover on the exchange for an asset, and the fewer opportunities to enter with leverage, the less volatile the price and the more beautiful and accurate the chart.
Works on all assets. There is a subscription limit (the number of calculated bars) that has little effect on anything. Can be applied to any asset where there is volume (not SPX, but ES1, not MOEX, but MX1!).
Перевод на русский.
Вчера написал с помощью AI простой и легкий код индикатора "Кумулятивная Дельта Объема со скользящей средней".
Введение:
Дельта (Delta) — это разница между покупками и продажами. Если покупок больше — дельта положительная, если больше продаж — дельта отрицательная. Мы смотрим на каждую свечу отдельно на том или ином таймфрейме, что не дает нам общей картины во времени.
Кумулятивная дельта объема — во многом продолжение дельты объёмов, но она включает более длительные периоды времени и дает другие торговые сигналы. Как и индикатор дельты объёма, индикатор кумулятивной дельты объема (Cumulative Volume Delta, CVD) измеряет связь между давлением покупателей и продавцов, но при этом не фокусируется на одной конкретной свече (или другом элементе графика), а дает картину во времени.
Что хотел получить?
Часто видел, что к кумулятивной детьте объема пытались прикрепить RSI и облако ишимоку, но никогда не видел кумулятивную дельту объема со скользящей средней. Скользящая средняя которая берет данные от кумулятивной дельты объема будет отличатся от скользящей средней основного актива. Было замечено, что часто в местах пересечения кумулятивной дельты объема и скользящей средней - это более точный сигнал к покупке или продаже, чем такие же пересечения по основному активу.
Изначально было сделанно 5 скользящих со значениями 21, 55, 89, 144 и 233, но я понял, что это перегружает график. Проще менять длину скользящей средней от используемого таймфрейма, чем перегружать график. Финальный вариант с одной скользящей SMA, EMA, RMA, WMA, HMA.
Логика применения скользящей средней к кумулятивной дельте объема:
Вы выбираете скользящую среднюю, так же как и на основном активе. Применяйте ту скользящую среднюю, которая вам нравится и период, с которым привыкли работать. На каждом TF свои настройки.
Что мы видим на графике:
Это не осциллятор, а адаптированная версия к свечному графику (только линия). С помощью него вы можете наглядно посмотреть куда движется рынок по кумулятивной дельте объема. Самое интересное, что вы можете включить свою скользящую среднюю, применимую к кумулятивной дельте объема. Благодаря этому вы можете видеть трендовое движение, возврат к средней скользящей для продолжения тренда.
Не потерянные возможности:
Самое интересное, что осталась возможность наблюдать за дивергенцией актива и кумулятивной дельтой объема. Это дает большое преимущество. Те кто не работал с дивергенцией не бросайтесь на нее сразу. Может быть и 3 пика в дивергенции (как с перепроданностью / перекупленностью), но работает в разы четче чем RSI и MACD.
Вот хороший пример на дневном графике. Момент когда мы все ждали 75000. Кумулятивная Дельта Объема падала с каждым пиком, в то время как ценовой график (вершины) были примерно на уровне.
Обычно закидывают (разрешают покупать) без объема на продажи (дельта вниз цена вверх), чтобы слить по более интересной цене. И также сливают без объема покупок для сквиза (цена вниз / дельта вверх) и опять откупаю по более интересной цене. Существуют более сложные варианты оценки, можете почитать про дивергенцию кумулятивной дельты объема CVD. Только рекомендую сделать бэктест.
Рекомендации:
Еще момент. Используйте индикатор, на бирже, там где больше всего денег, по обороту и по активу. Выбирайте не Bybit, а Binance. Т.е. выбираете актив BTC, к примеру, но на бирже Binance. Не фьючерс, а спот.
Чем более большие обороты на бирже, по активу, и меньше возможностей заходить с плечами, тем менее волатильная цена и более красивый и точный график.
Работает на всех активах. Есть ограничение по подписке (количество рассчитываемых баров) мало влияет на что. Можно применить к любому активу где есть объем (не SPX, а ES1, не MOEX, а MX1!).
Notas de prensa
Friends. Yesterday I wrote a simple and easy code for the indicator "Cumulative Delta Volume with a moving average" using AI.Introduction:
Delta is the difference between buys and sells. If there are more purchases, the delta is positive, if there are more sales, the delta is negative. We look at each candle separately on a particular time frame, which does not give us an overall picture over time.
Cumulative volume delta is in many ways an extension of volume delta, but it covers longer periods of time and provides different trading signals. Like the volume delta indicator, the Cumulative Volume Delta (CVD) indicator measures the relationship between buying and selling pressure, but does not focus on one specific candle (or other chart element), but rather provides a map over time.
What did you want to get?
I have often seen that they tried to attach "RSI" and an "Ichimoku cloud" to the cumulative volume delta, but I have never seen a cumulative volume delta with a moving average. A moving average that takes data from the cumulative volume delta will be different from the moving average of the underlying asset. It was noticed that often at the intersection of the cumulative volume delta and the moving average, this is a more accurate signal to buy or sell than the same intersections for the underlying asset.
Initially, 5 moving averages were made with values of 21, 55, 89, 144 and 233, but I realized that this overloads the chart. It is easier to change the length of the moving average depending on the time frame you are using than to overload the chart. The final version with one moving SMA, EMA, RMA, WMA, HMA.
The logic for applying a moving average to a cumulative volume delta:
You choose a moving average, just like you would on your underlying asset. Use the moving average you like and the period you are used to working with. Each TF has its own settings.
What we see on the graph:
This is not an oscillator, but an adapted version for a candlestick chart (line only). Using it, you can clearly see where the market is moving based on the cumulative volume delta. The cool thing is that you can include your moving average applied to the cumulative volume delta. Thanks to this, you can see a trend movement, a return to the average moving average to continue the trend.
Opportunities not lost:
The most interesting thing is that it remains possible to observe the divergence of the asset and the cumulative delta of the volume. This gives a great advantage. Those who have not worked with divergence do not rush into it right away. There may be 3 peaks in divergence (as with oversold/overbought), but it works many times more clearly than RSI and MACD.
Here's a good example on the daily chart. The moment we were all waiting for 75,000. The cumulative Delta Volume fell with each peak, while the price chart (tops) were approximately level.
Usually they throw (allow to buy) without volume for sales (delta down, price up) in order to merge at a more interesting price. And they also drain without the volume of purchases for a squeeze (price down / delta up) and again I buy back at a more interesting price. There are more complex estimation options; you can read about the divergence of the cumulative delta of the CVD volume. I just recommend doing a backtest.
Recommendations:
One more moment. Use the indicator on the stock exchange, where there is the most money, by turnover and by asset. Choose Binance, not Bybit. Those. choose the BTC asset, for example, but on the Binance exchange. Not futures, but spot.
The greater the turnover on the exchange for an asset, and the fewer opportunities to enter with leverage, the less volatile the price and the more beautiful and accurate the chart.
Works on all assets. There is a subscription limit (the number of calculated bars) that has little effect on anything. Can be applied to any asset where there is volume (not SPX, but ES1, not MOEX, but MX1!).
Notas de prensa
Fixed:Installation occurs in a new window.
Fixed a bug with the sliding average of the HMA.
Notas de prensa
CVD PRO [SYNC & TRADE] Indicator GuideGeneral Description
CVD PRO [SYNC & TRADE] is an advanced market analysis indicator based on Cumulative Volume Delta (CVD). It helps identify trends, entry and exit points, and provides statistics on signal performance.
Main features of the indicator
1. Setting up optimization parameters
For long positions (Long):
Moving average length (default 89)
Multiplier for calculations (default 1.62)
ATR period length (default 46)
For short positions (Short):
Similar parameters with the ability to independently configure
2. Flexible strategy settings
Ability to enable/disable signals for long positions
Ability to enable/disable signals for short positions
Work with different timeframes (daily, weekly, monthly)
Integration of volume analysis
3. Visual elements
Main display elements:
Trend line with dynamic color change (blue - ascending, red - descending)
Cloud around the main line to determine uncertainty zones
Three levels of parallel lines above and below the main line
Information panels:
Market status table
Signal efficiency statistics
Customizable size font
4. Market condition analysis
The indicator detects the following conditions:
Strong uptrend
Strong downtrend
Level testing
Sideways movement
5. Alert system
Customizable alerts for:
Trend change to uptrend
Trend change to downtrend
Reaching key levels
Pattern formation
How to use the indicator
Basic setup
Initial setup:
Start with default parameters
Select your preferred trading type (long or short)
Configure the display of information tables
Display setup:
Select a convenient font size
Configure the visibility of various elements
Determine whether to display statistics
Advanced use
Parameter optimization:
Select the optimal length of the average
Configure the multiplier for the volatility of the instrument
Set the appropriate ATR length
Working with volume:
Enable volume integration for accurate signals
Analyze the difference between regular and volume CVD
Use volume confirmation for signals
Multi-timeframe analysis:
Use higher timeframe data
Compare signals on different time periods
Consider long-term trends
Interpretation of signals
Strong trend
CVD is above/below the middle line
Clear direction of movement
High percentage of successful signals
Testing levels
CVD in the cloud area
Possible formation of a reversal
Additional confirmation is needed
Sideways movement
CVD between the first parallel lines
Low volatility
Caution in trading is recommended
Statistics and analysis of efficiency
Tracked parameters
Total number of signals
Percentage of successful signals
Separate statistics for long and short positions
Using statistics
Analysis of strategy efficiency
Optimization of parameters
Determining the best conditions for entry
Trading recommendations
Opening positions:
Wait for a clear signal
Check confirmation by volume
Consider the general state of the market
Risk management:
Use parallel lines to stop-loss
Consider the volatility of the instrument
Monitor the success statistics
Closing positions:
Monitor signs of a reversal
Use the cloud for partial fixation
Consider signals of the opposite direction
Руководство по индикатору CVD PRO [SYNC & TRADE]
Общее описание
CVD PRO [SYNC & TRADE] - это продвинутый индикатор для анализа рынка, который основан на кумулятивном дельта объеме (CVD). Он помогает определять тренды, точки входа и выхода из рынка, а также предоставляет статистику по эффективности сигналов.
Основные возможности индикатора
1. Настройка параметров оптимизации
Для длинных позиций (Long):
Длина скользящей средней (по умолчанию 89)
Множитель для расчетов (по умолчанию 1.62)
Длина периода ATR (по умолчанию 46)
Для коротких позиций (Short):
Аналогичные параметры с возможностью независимой настройки
2. Гибкие настройки стратегии
Возможность включения/отключения сигналов для длинных позиций
Возможность включения/отключения сигналов для коротких позиций
Работа с разными таймфреймами (дневной, недельный, месячный)
Интеграция объемного анализа
3. Визуальные элементы
Основные элементы отображения:
Линия тренда с динамическим изменением цвета (синий - восходящий, красный - нисходящий)
Облако вокруг основной линии для определения зон неопределенности
Три уровня параллельных линий выше и ниже основной линии
Информационные панели:
Таблица состояния рынка
Статистика эффективности сигналов
Настраиваемый размер шрифта
4. Анализ состояния рынка
Индикатор определяет следующие состояния:
Сильный восходящий тренд
Сильный нисходящий тренд
Тестирование уровней
Боковое движение
5. Система оповещений
Настраиваемые алерты на:
Смену тренда на восходящий
Смену тренда на нисходящий
Достижение ключевых уровней
Формирование паттернов
Как использовать индикатор
Базовая настройка
Первичная установка:
Начните с параметров по умолчанию
Выберите предпочтительный тип торговли (long или short)
Настройте отображение информационных таблиц
Настройка отображения:
Выберите удобный размер шрифта
Настройте видимость различных элементов
Определите необходимость показа статистики
Продвинутое использование
Оптимизация параметров:
Подберите оптимальную длину средней
Настройте множитель под волатильность инструмента
Установите подходящую длину ATR
Работа с объемом:
Включите интеграцию объема для точных сигналов
Анализируйте разницу между обычным и объемным CVD
Используйте объемные подтверждения для сигналов
Многотаймфреймный анализ:
Используйте данные старшего таймфрейма
Сверяйте сигналы по разным временным периодам
Учитывайте долгосрочные тренды
Интерпретация сигналов
Сильный тренд
CVD находится выше/ниже средней линии
Четкое направление движения
Высокий процент успешных сигналов
Тестирование уровней
CVD в зоне облака
Возможное формирование разворота
Необходимо дополнительное подтверждение
Боковое движение
CVD между первыми параллельными линиями
Низкая волатильность
Рекомендуется осторожность в торговле
Статистика и анализ эффективности
Отслеживаемые параметры
Общее количество сигналов
Процент успешных сигналов
Отдельная статистика для long и short позиций
Использование статистики
Анализ эффективности стратегии
Оптимизация параметров
Определение лучших условий для входа
Рекомендации по торговле
Открытие позиций:
Дождитесь четкого сигнала
Проверьте подтверждение объемом
Учитывайте общее состояние рынка
Управление рисками:
Используйте параллельные линии для стоп-лоссов
Учитывайте волатильность инструмента
Следите за статистикой успешности
Закрытие позиций:
Отслеживайте признаки разворота
Используйте облако для частичной фиксации
Учитывайте сигналы противоположного направления
Notas de prensa
For convenience, an option to disable display of base parallel distance on the graph has been added.Для удобства добавлена опция отключения отображения base parallel distance на графике.
Notas de prensa
CVD PRO [SYNC & TRADE] Indicator for TradingViewThis indicator is an advanced version of Cumulative Volume Delta (CVD), allowing you to analyze volume flows in the market with different settings for long and short positions.
Operating principle
The indicator calculates the cumulative volume delta indicator, taking into account the ratio of volume to price change, and displays it as a line or candles. Moving averages with flexible settings and cloud areas are used for trend analysis.
Main components
Strategy settings
Long/Short Settings: Ability to enable/disable and independently configure parameters for long and short positions
MA Length and MA Type: Parameters for two moving averages for each type of position (length and type: SMA, EMA, WMA, RMA, HMA)\n- Multiplier and Length: Multipliers and periods for calculating indicator zones
CVD calculation
The indicator offers two methods for calculating CVD:
With volume integration: volume * (close - open)\n2. With range normalization: volume * (close - open) / (high - low)
Cloud zones and parallel lines
Dynamic cloud: Zones around moving averages calculated taking into account market volatility
Parallel lines: Additional levels at a specified distance from the moving average (optional)
Analysis on higher timeframes
The ability to use data from higher timeframes (D, W, M) to calculate the indicator, which allows you to take into account long-term trends.
Visualization
CVD display type: Line or candlesticks
Bar coloring: Depending on the indicator value and its position relative to the levels
Market status table: Displays the current state (Long, Short, Test, Sideways)
Market status definition
The indicator classifies the current market state:
Long: CVD is above both moving averages (Long and Short)
Short: CVD is below both moving averages
Test: CVD is testing the cloud boundaries (located between the moving average and the upper/lower cloud boundary)
Sideways: CVD is in a sideways range (between parallel lines)
Adaptation to volatility
The indicator automatically adapts to changes in market volatility:
Dynamic cloud distance changing depending on the ratio of current volatility to average
Dynamic multipliers for calculating boundaries adapting to ATR changes
Alerts
Built-in conditions for alerts:
Long trend transition to an upward direction
Long trend transition to a downward direction
Short trend transition to an upward direction
Short trend transition to a downward direction
Application
The indicator can be used to:
Determine the strength of a trend based on volume flows
Identify potential reversal zones when testing cloud boundaries
Build trading strategies taking into account a trend change
Analyze sideways market movements and their boundaries
The main advantage of the indicator is its comprehensive analysis of volume flows taking into account volatility and the ability to adapt to various market conditions.
The CVD PRO Premium indicator is a powerful tool for analyzing volume flows in the market using Cumulative Volume Delta (CVD). It calculates the cumulative ratio of volume to price change, which allows you to identify imbalances in supply and demand.
Key features of the indicator:
Separate settings for Long and Short positions with the ability to use different types and periods of moving averages
Dynamic cloud zones that adapt to market volatility
Ability to analyze on higher timeframes (D, W, M)
Visual table of market conditions with classification of the current situation
The indicator determines four market conditions: Long, Short, Test and Sideways, which helps to make more informed trading decisions taking into account current volume flows.
Notas de prensa
CVD PRO [SYNC & TRADE] Indicator for TradingViewThis indicator is an advanced version of Cumulative Volume Delta (CVD), allowing you to analyze volume flows in the market with different settings for long and short positions.
Operating principle
The indicator calculates the cumulative volume delta indicator, taking into account the ratio of volume to price change, and displays it as a line or candles. Moving averages with flexible settings and cloud areas are used for trend analysis.
Main components
Strategy settings
Long/Short Settings: Ability to enable/disable and independently configure parameters for long and short positions
MA Length and MA Type: Parameters for two moving averages for each type of position (length and type: SMA, EMA, WMA, RMA, HMA)\n- Multiplier and Length: Multipliers and periods for calculating indicator zones
CVD calculation
The indicator offers two methods for calculating CVD:
With volume integration: volume * (close - open)\n2. With range normalization: volume * (close - open) / (high - low)
Cloud zones and parallel lines
Dynamic cloud: Zones around moving averages calculated taking into account market volatility
Parallel lines: Additional levels at a specified distance from the moving average (optional)
Analysis on higher timeframes
The ability to use data from higher timeframes (D, W, M) to calculate the indicator, which allows you to take into account long-term trends.
Visualization
CVD display type: Line or candlesticks
Bar coloring: Depending on the indicator value and its position relative to the levels
Market status table: Displays the current state (Long, Short, Test, Sideways)
Market status definition
The indicator classifies the current market state:
Long: CVD is above both moving averages (Long and Short)
Short: CVD is below both moving averages
Test: CVD is testing the cloud boundaries (located between the moving average and the upper/lower cloud boundary)
Sideways: CVD is in a sideways range (between parallel lines)
Adaptation to volatility
The indicator automatically adapts to changes in market volatility:
Dynamic cloud distance changing depending on the ratio of current volatility to average
Dynamic multipliers for calculating boundaries adapting to ATR changes
Alerts
Built-in conditions for alerts:
Long trend transition to an upward direction
Long trend transition to a downward direction
Short trend transition to an upward direction
Short trend transition to a downward direction
Application
The indicator can be used to:
Determine the strength of a trend based on volume flows
Identify potential reversal zones when testing cloud boundaries
Build trading strategies taking into account a trend change
Analyze sideways market movements and their boundaries
The main advantage of the indicator is its comprehensive analysis of volume flows taking into account volatility and the ability to adapt to various market conditions.
The CVD PRO Premium indicator is a powerful tool for analyzing volume flows in the market using Cumulative Volume Delta (CVD). It calculates the cumulative ratio of volume to price change, which allows you to identify imbalances in supply and demand.
Key features of the indicator:
Separate settings for Long and Short positions with the ability to use different types and periods of moving averages
Dynamic cloud zones that adapt to market volatility
Ability to analyze on higher timeframes (D, W, M)
Visual table of market conditions with classification of the current situation
The indicator determines four market conditions: Long, Short, Test and Sideways, which helps to make more informed trading decisions taking into account current volume flows.
Notas de prensa
Alerts to enter states:Enter Long State: triggered when CVD is above both long moving averages.
Enter Short State: triggered when CVD is below both short moving averages.
Enter Test Long State: triggered when CVD starts testing the Long cloud.
Enter Test Short State: triggered when CVD starts testing the Short cloud.
Enter Sideways Long State: triggered when CVD enters a sideways Long range.
Enter Sideways Short State: triggered when CVD enters a sideways Short range.
Alerts to exit states:
Exit Long State: triggered when CVD exits the Long state.
Exit Short State: triggered when CVD exits the Short state.
Exit Test Long State: triggered when CVD exits the Long cloud test.
Exit Test Short State: triggered when CVD exits the Short cloud test.
Exit Sideways Long State: Triggered when CVD exits the sideways Long range.
Exit Sideways Short State: Triggered when CVD exits the sideways Short range.
Notas de prensa
What's changed:Added an auto-scaling feature
Notas de prensa
Rollback to a tested version.Notas de prensa
Divergence search added. Automatically with different lengths on different timeframes.Notas de prensa
## CVD with Moving Average + Divergence v2Two new features added to the CVD indicator.
### Rolling Channel
Adaptive channel of 6 lines around a moving average — 3 above and 3 below at 30%, 50%, 70% of the range. Replaces the old ATR-based parallel lines that needed manual tuning per timeframe. Works on any TF without adjustments.
Four calculation methods, switchable from a dropdown:
- **Highest/Lowest of CVD** — uses max/min of cumulative CVD
- **Highest/Lowest of Delta** — uses per-bar delta, faster to react
- **Stdev (Bollinger-style)** — classic standard deviation, smoothest
- **Percentile** — uses 95th/5th percentile, ignores outliers
Try all four and pick the one that fits your style. CVD inside the inner ±30% zone = Sideways state in the table.
### CVD vs Price Divergence Detector
Detects classic bull/bear divergences between price and CVD on swing points:
- **Bearish:** price higher high + CVD lower high — exhausted buyers
- **Bullish:** price lower low + CVD higher low — exhausted sellers
Lines are drawn directly on the price chart. Pivot lookback adapts automatically by timeframe: 1W/1D → 5, 4H → 8, 1H and below → 20. Manual override available.
Alerts included for both divergence types.
### Best practice
Higher timeframes give cleaner signals. 1D and 1W are most reliable. On lower TFs use larger pivot lookback to filter noise.
Notas de prensa
The search for divergence is accelerated to one bar. The search occurs on the current bar.Notas de prensa
CVD with Moving Average + DivergenceFree and open-source. A tribute to all the open scripts we learned from. Currently used by 770+ traders.
────────────────────────
WHAT IT DOES
Plots Cumulative Volume Delta (CVD) — the running balance of buying vs selling pressure — and detects divergences between price and CVD.
The logic: if price prints a new high but buying pressure (CVD) does not, the move is running out of fuel. Mirrored for lows.
It draws the CVD line with moving averages, a volatility cloud, a rolling channel, divergences (8 independent branches), trend-based bar coloring, and a Market State table.
────────────────────────
THE KEY POINT: WE REMOVED DIVERGENCE LAG
Classic divergence detectors signal late — only once a price pivot is fully confirmed, which takes as many bars as the lookback window. By the time the signal appears, the move is often gone.
We rebuilt the logic so a divergence is confirmed by the structure of CVD itself, not by the delayed confirmation of a price pivot. The signal appears several bars earlier and does not repaint. The full mechanism is in the code comments for other developers. Cost of this result: 4 days, 12 iterations. Worth it.
────────────────────────
HOW TO READ THE SIGNALS
🔻 Red line (Div▼) — bearish. Price made a higher high, CVD did not.
🔺 Green line (Div▲) — bullish. Price made a lower low, CVD did not.
Label, e.g. Div▼ [20*1.7]: 20 = the branch (lookback) — smaller = smaller swings/more frequent, larger = bigger swings/rarer and stronger. 1.7 = swing depth in ATR14 units — higher = stronger divergence.
Line transparency = signal weight. Faint = short branch (noisier). Bold = long branch (more serious). Big divergences visually dominate small ones.
Market State table: Long (CVD above both long MAs) · Short (below both short MAs) · Test (testing the cloud) · Sideways (inside inner channel, no clear pressure).
Bar coloring: 🟦 Blue = uptrend, 🟥 Red = downtrend, gray = undecided.
────────────────────────
SETTINGS
Most values are hard-coded to sensible defaults to keep the panel clean. What remains:
TF Adaptation — Auto adapts MA lengths to the chart TF; Custom uses the fields below (defaults tuned for the daily).
Long / Short Settings — enable each MA set; MA Length + Type set smoothing (shorter = faster/noisier); Multiplier/Length are ATR params for cloud and bar coloring.
Volatility — Dynamic Cloud Distance widens the cloud with volatility (recommended on).
Rolling Channel — Method: Highest/Lowest of CVD (classic) · of Delta · Stdev (adaptive) · Percentile (outlier-robust). Window + Anchor MA set range and center.
Divergence
— Swing min depth (× ATR14): minimum swing depth to count. 0 = off, 1.0 = ignores swings under one ATR. Main noise filter — raise if too many signals.
— Confirmed: pivot memory: past pivots kept for base search. 1 = previous pivot only. Higher = see divergence "through" intermediate peaks.
— Confirmed: max base breach (× ATR14): how far price may pierce the base before the signal is cancelled. 0 = strict, higher = tolerant of wick noise.
— Show bullish/bearish, colors, line width, Label Style, and a master toggle for all 8 branches.
Branches (hard-coded): 8 lookbacks 3 / 5 / 8 / 13 / 20 / 50 / 100 / 200 run in parallel. Short catch small swings, long catch major reversals. On the daily the longest (100, 200) fire rarely — expected; more useful on lower TFs.
────────────────────────
BEFORE YOU USE IT
A divergence is a sign of weakening, not an entry order — confirm with context and your risk management. Branches behave differently across timeframes; test on your instrument and TF first. Analysis tool, not financial advice.
Made with respect for open-source. Open scripts taught us once — this is the gesture back.
Notas de prensa
────────────────────────🇬🇧 ENGLISH
────────────────────────
What's new
Swing min depth filter fixed. Previously the parameter worked against itself: the internal "swing low" variable was reset on every new fast pivot, so the filter rejected valid divergences even at the default 1.0. The variable now correctly tracks the real minimum/maximum between the base and the current peak. Swing min depth works as intended again — the main noise regulator.
Base breach check fixed. The logic now accounts for the fact that the right pivot itself cannot trigger a "base breach". This restores previously missed valid signals where the new peak was higher than the base by more than 0.5 ATR — i.e. the basic definition of a bearish divergence.
Moving average visual hierarchy. Main Long and Short MAs now have linewidth 2 by default, secondary ones (Long 2, Short 2) remain at linewidth 1. The reference lines are immediately visible.
New toggle: Recolor MA by trend. On by default — behaves as before (blue up / red down / gray flat). Turn it off and long MAs stay blue, short MAs stay red. Convenient for those who read the chart with a fixed color scheme.
Unchanged: anti-lag divergence detection (v10), 8 parallel branches (v12), all settings. Old signals do not repaint. Anti-lag logic untouched.
Notas de prensa
What's newSwing min depth filter fixed. Previously the parameter worked against itself: the internal "swing low" variable was reset on every new fast pivot, so the filter rejected valid divergences even at the default 1.0. The variable now correctly tracks the real minimum/maximum between the base and the current peak. Swing min depth works as intended again — the main noise regulator.
Base breach check fixed. The logic now accounts for the fact that the right pivot itself cannot trigger a "base breach". This restores previously missed valid signals where the new peak was higher than the base by more than 0.5 ATR — i.e. the basic definition of a bearish divergence.
Moving average visual hierarchy. Main Long and Short MAs now have linewidth 2 by default, secondary ones (Long 2, Short 2) remain at linewidth 1. The reference lines are immediately visible.
New toggle: Recolor MA by trend. Off by default — long MAs always blue, short MAs always red. Turn it on to get the previous behavior (blue up / red down / gray flat).
Rolling Channel hidden by default. The Show Rolling Channel toggle is now off by default to keep the panel cleaner. Turn it on in settings if you use the channel levels.
Unchanged: anti-lag divergence detection, 8 parallel branches, all settings. Old signals do not repaint. Anti-lag logic untouched.
Script de código abierto
Fiel al espíritu de TradingView, el creador de este script lo ha convertido en código abierto, para que los traders puedan revisar y verificar su funcionalidad. ¡Enhorabuena al autor! Aunque puede utilizarlo de forma gratuita, recuerde que cualquier republicación del código está sujeta a nuestras Normas internas.

🎯 SYNC-AND-TRADE · sync-and-trade.com
🇬🇧 Live GEX levels for BTC/ETH/SOL: where dealers hold or release price. Briefing, course, alerts.
🇷🇺 Живые уровни GEX: где цену придержат, где отпустят. Разбор, курс, оповещения.
✉️ t.me/SyncAndTrade
🇬🇧 Live GEX levels for BTC/ETH/SOL: where dealers hold or release price. Briefing, course, alerts.
🇷🇺 Живые уровни GEX: где цену придержат, где отпустят. Разбор, курс, оповещения.
✉️ t.me/SyncAndTrade
Exención de responsabilidad
La información y las publicaciones no constituyen, ni deben considerarse como, asesoramiento o recomendaciones financieras, de inversión, de trading u otro tipo, proporcionadas o respaldadas por TradingView. Obtenga más información en Condiciones de uso.
Script de código abierto
Fiel al espíritu de TradingView, el creador de este script lo ha convertido en código abierto, para que los traders puedan revisar y verificar su funcionalidad. ¡Enhorabuena al autor! Aunque puede utilizarlo de forma gratuita, recuerde que cualquier republicación del código está sujeta a nuestras Normas internas.
🎯 SYNC-AND-TRADE · sync-and-trade.com
🇬🇧 Live GEX levels for BTC/ETH/SOL: where dealers hold or release price. Briefing, course, alerts.
🇷🇺 Живые уровни GEX: где цену придержат, где отпустят. Разбор, курс, оповещения.
✉️ t.me/SyncAndTrade
🇬🇧 Live GEX levels for BTC/ETH/SOL: where dealers hold or release price. Briefing, course, alerts.
🇷🇺 Живые уровни GEX: где цену придержат, где отпустят. Разбор, курс, оповещения.
✉️ t.me/SyncAndTrade
Exención de responsabilidad
La información y las publicaciones no constituyen, ni deben considerarse como, asesoramiento o recomendaciones financieras, de inversión, de trading u otro tipo, proporcionadas o respaldadas por TradingView. Obtenga más información en Condiciones de uso.