OPEN-SOURCE SCRIPT
Actualizado Pivot Breakout High&Low Signals [JPT]
🔷 OVERVIEW

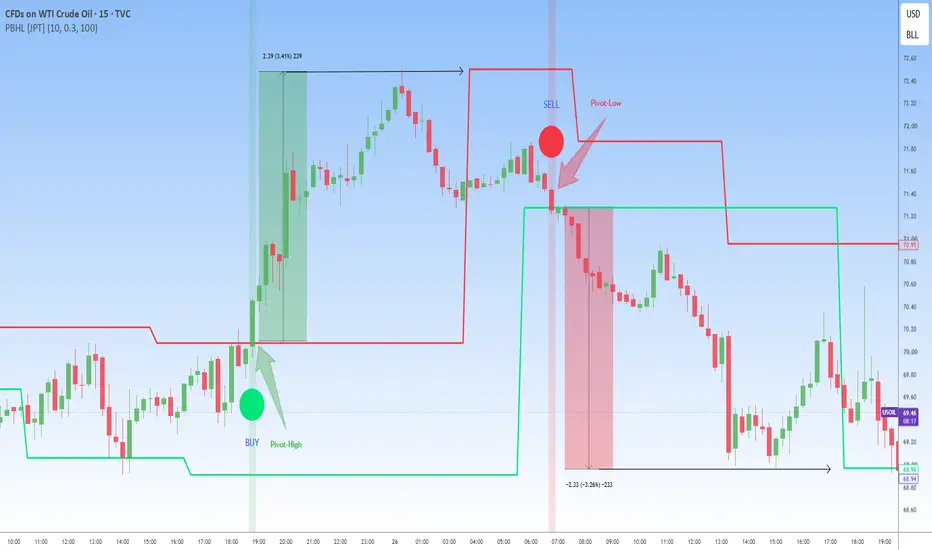
Pivot Breakout High&Low Signals [JPT] is a non-repainting price action indicator that automatically identifies Pivot High and Pivot Low breakout opportunities using a Breakout → Retest → Confirmation methodology.
Instead of generating signals immediately after price breaks a pivot level, the indicator waits for price to successfully retest the broken support or resistance before displaying a BUY or SELL signal. This approach helps reduce false breakouts and provides higher-quality trading opportunities.
The indicator continuously updates dynamic Pivot High resistance and Pivot Low support levels, making it easier to visualize market structure and identify potential breakout zones.
--------------------------------------------------
🔷 HOW IT WORKS
The indicator continuously scans completed candles for confirmed Pivot Highs and Pivot Lows.
When breakout conditions are satisfied, it:
• Detects a confirmed Pivot High or Pivot Low
• Monitors for a breakout above resistance or below support
• Waits for price to retest the breakout level
• Confirms buyer or seller rejection
• Displays a BUY or SELL signal
• Updates Pivot Support and Resistance levels automatically
• Optionally filters signals using the EMA trend direction
Only confirmed breakout and retest setups generate trading signals.
--------------------------------------------------
🔷 CHART SETUP ① – BULLISH PIVOT BREAKOUT
📈 Pivot High → Breakout → LONG → SINGAL

• Price forms a confirmed Pivot High.
• Buyers break above the Pivot High resistance.
• Price retraces to retest the breakout level.
• The previous resistance becomes new support.
• Buyers defend the support.
• The indicator plots a BUY signal after confirmation.
This setup helps traders avoid chasing breakouts and instead enter after confirmation.
--------------------------------------------------
🔷 CHART SETUP ② – BEARISH PIVOT BREAKDOWN
📉 Pivot Low → Breakdown → SHORT → SINGAL

• Price forms a confirmed Pivot Low.
• Sellers break below the Pivot Low support.
• Price pulls back to retest the broken support.
• The previous support becomes new resistance.
• Sellers reject the retest.
• The indicator plots a SELL signal after confirmation.
This confirmation helps reduce false breakdown entries during sideways markets.
--------------------------------------------------
🔷 CHART SETUP ③ – DYNAMIC PIVOT STRUCTURE

Throughout every trend, the indicator continuously updates:
• Pivot Higher Resistance
• Pivot Lower Support
These dynamic levels help traders:
• Identify trend direction
• Monitor breakout zones
• Observe changing market structure
• Anticipate future breakout opportunities
The Pivot lines automatically adjust as new confirmed swing highs and lows are formed.
--------------------------------------------------
🔷 VISUAL FEATURES
• Automatic BUY & SELL Signals
• Dynamic Pivot High Resistance
• Dynamic Pivot Low Support
• Breakout Confirmation
• Retest Confirmation
• Optional EMA Trend Filter
• Historical Signal Display
• Background Signal Highlight
• Clean & Lightweight Chart Layout
• Non-Repainting Pivot Logic
--------------------------------------------------
🔷 INPUTS
The indicator includes options to customize:
• Pivot Length
• Retest Tolerance (%)
• EMA Length
• Enable / Disable EMA Trend Filter
• Signal Colors
• Historical Signal Display
--------------------------------------------------
🔷 USAGE
A common workflow is:
• Wait for a confirmed BUY or SELL signal.
• Confirm that price has completed the breakout and retest.
• Use the Pivot Support or Resistance level as your trade reference.
• Manage your trade using your own stop-loss and take-profit strategy.
• Combine signals with higher-timeframe trend analysis, support/resistance, or volume for additional confirmation.
--------------------------------------------------
🔷 BEST MARKETS
The indicator can be applied to:
• Forex
• Gold (XAUUSD)
• Silver (XAGUSD)
• Crude Oil
• Cryptocurrency
• Stocks
• Indices
• Commodities
--------------------------------------------------
🔷 RECOMMENDED TIMEFRAMES
The indicator works across all timeframes.
Recommended:
• 15 Minutes
• 30 Minutes
• 1 Hour
• 2 Hours
• 4 Hours
• Daily
Higher timeframes generally produce stronger breakout confirmations and more reliable retest signals.
-------------------------------------------------------
🔷 DISCLAIMER
This indicator is designed as a technical analysis tool and does not predict future price movements. BUY and SELL signals are generated according to the programmed Pivot Breakout and Retest logic and should be used alongside additional market analysis, sound risk management, and appropriate trade planning. No indicator guarantees profitable trading results.
Developed by Jos-ProTrader (JPT)
Pivot Breakout High&Low Signals [JPT] is a non-repainting price action indicator that automatically identifies Pivot High and Pivot Low breakout opportunities using a Breakout → Retest → Confirmation methodology.
Instead of generating signals immediately after price breaks a pivot level, the indicator waits for price to successfully retest the broken support or resistance before displaying a BUY or SELL signal. This approach helps reduce false breakouts and provides higher-quality trading opportunities.
The indicator continuously updates dynamic Pivot High resistance and Pivot Low support levels, making it easier to visualize market structure and identify potential breakout zones.
--------------------------------------------------
🔷 HOW IT WORKS
The indicator continuously scans completed candles for confirmed Pivot Highs and Pivot Lows.
When breakout conditions are satisfied, it:
• Detects a confirmed Pivot High or Pivot Low
• Monitors for a breakout above resistance or below support
• Waits for price to retest the breakout level
• Confirms buyer or seller rejection
• Displays a BUY or SELL signal
• Updates Pivot Support and Resistance levels automatically
• Optionally filters signals using the EMA trend direction
Only confirmed breakout and retest setups generate trading signals.
--------------------------------------------------
🔷 CHART SETUP ① – BULLISH PIVOT BREAKOUT
📈 Pivot High → Breakout → LONG → SINGAL
• Price forms a confirmed Pivot High.
• Buyers break above the Pivot High resistance.
• Price retraces to retest the breakout level.
• The previous resistance becomes new support.
• Buyers defend the support.
• The indicator plots a BUY signal after confirmation.
This setup helps traders avoid chasing breakouts and instead enter after confirmation.
--------------------------------------------------
🔷 CHART SETUP ② – BEARISH PIVOT BREAKDOWN
📉 Pivot Low → Breakdown → SHORT → SINGAL
• Price forms a confirmed Pivot Low.
• Sellers break below the Pivot Low support.
• Price pulls back to retest the broken support.
• The previous support becomes new resistance.
• Sellers reject the retest.
• The indicator plots a SELL signal after confirmation.
This confirmation helps reduce false breakdown entries during sideways markets.
--------------------------------------------------
🔷 CHART SETUP ③ – DYNAMIC PIVOT STRUCTURE
Throughout every trend, the indicator continuously updates:
• Pivot Higher Resistance
• Pivot Lower Support
These dynamic levels help traders:
• Identify trend direction
• Monitor breakout zones
• Observe changing market structure
• Anticipate future breakout opportunities
The Pivot lines automatically adjust as new confirmed swing highs and lows are formed.
--------------------------------------------------
🔷 VISUAL FEATURES
• Automatic BUY & SELL Signals
• Dynamic Pivot High Resistance
• Dynamic Pivot Low Support
• Breakout Confirmation
• Retest Confirmation
• Optional EMA Trend Filter
• Historical Signal Display
• Background Signal Highlight
• Clean & Lightweight Chart Layout
• Non-Repainting Pivot Logic
--------------------------------------------------
🔷 INPUTS
The indicator includes options to customize:
• Pivot Length
• Retest Tolerance (%)
• EMA Length
• Enable / Disable EMA Trend Filter
• Signal Colors
• Historical Signal Display
--------------------------------------------------
🔷 USAGE
A common workflow is:
• Wait for a confirmed BUY or SELL signal.
• Confirm that price has completed the breakout and retest.
• Use the Pivot Support or Resistance level as your trade reference.
• Manage your trade using your own stop-loss and take-profit strategy.
• Combine signals with higher-timeframe trend analysis, support/resistance, or volume for additional confirmation.
--------------------------------------------------
🔷 BEST MARKETS
The indicator can be applied to:
• Forex
• Gold (XAUUSD)
• Silver (XAGUSD)
• Crude Oil
• Cryptocurrency
• Stocks
• Indices
• Commodities
--------------------------------------------------
🔷 RECOMMENDED TIMEFRAMES
The indicator works across all timeframes.
Recommended:
• 15 Minutes
• 30 Minutes
• 1 Hour
• 2 Hours
• 4 Hours
• Daily
Higher timeframes generally produce stronger breakout confirmations and more reliable retest signals.
-------------------------------------------------------
🔷 DISCLAIMER
This indicator is designed as a technical analysis tool and does not predict future price movements. BUY and SELL signals are generated according to the programmed Pivot Breakout and Retest logic and should be used alongside additional market analysis, sound risk management, and appropriate trade planning. No indicator guarantees profitable trading results.
Developed by Jos-ProTrader (JPT)
Notas de prensa
Added a comprehensive Advanced Alerts system for all major trading events.Introduced separate alerts for Bullish and Bearish Pivot Breakouts.
Script de código abierto
Fiel al espíritu de TradingView, el creador de este script lo ha convertido en código abierto, para que los traders puedan revisar y verificar su funcionalidad. ¡Enhorabuena al autor! Aunque puede utilizarlo de forma gratuita, recuerde que cualquier republicación del código está sujeta a nuestras Normas internas.

📈 FREE TELEGRAM CHANNEL
🥇 Free Daily Forex, Gold & BTC Trade Signals
📚 Daily Trading Lessons & Technical Analysis
Learn, improve, and follow the market with us — completely FREE.
📲 Join Now: t.me/JosProTrader_050
🥇 Free Daily Forex, Gold & BTC Trade Signals
📚 Daily Trading Lessons & Technical Analysis
Learn, improve, and follow the market with us — completely FREE.
📲 Join Now: t.me/JosProTrader_050
Exención de responsabilidad
La información y las publicaciones no constituyen, ni deben considerarse como, asesoramiento o recomendaciones financieras, de inversión, de trading u otro tipo, proporcionadas o respaldadas por TradingView. Obtenga más información en Condiciones de uso.
Script de código abierto
Fiel al espíritu de TradingView, el creador de este script lo ha convertido en código abierto, para que los traders puedan revisar y verificar su funcionalidad. ¡Enhorabuena al autor! Aunque puede utilizarlo de forma gratuita, recuerde que cualquier republicación del código está sujeta a nuestras Normas internas.
📈 FREE TELEGRAM CHANNEL
🥇 Free Daily Forex, Gold & BTC Trade Signals
📚 Daily Trading Lessons & Technical Analysis
Learn, improve, and follow the market with us — completely FREE.
📲 Join Now: t.me/JosProTrader_050
🥇 Free Daily Forex, Gold & BTC Trade Signals
📚 Daily Trading Lessons & Technical Analysis
Learn, improve, and follow the market with us — completely FREE.
📲 Join Now: t.me/JosProTrader_050
Exención de responsabilidad
La información y las publicaciones no constituyen, ni deben considerarse como, asesoramiento o recomendaciones financieras, de inversión, de trading u otro tipo, proporcionadas o respaldadas por TradingView. Obtenga más información en Condiciones de uso.