OPEN-SOURCE SCRIPT
All In One [Minimal]
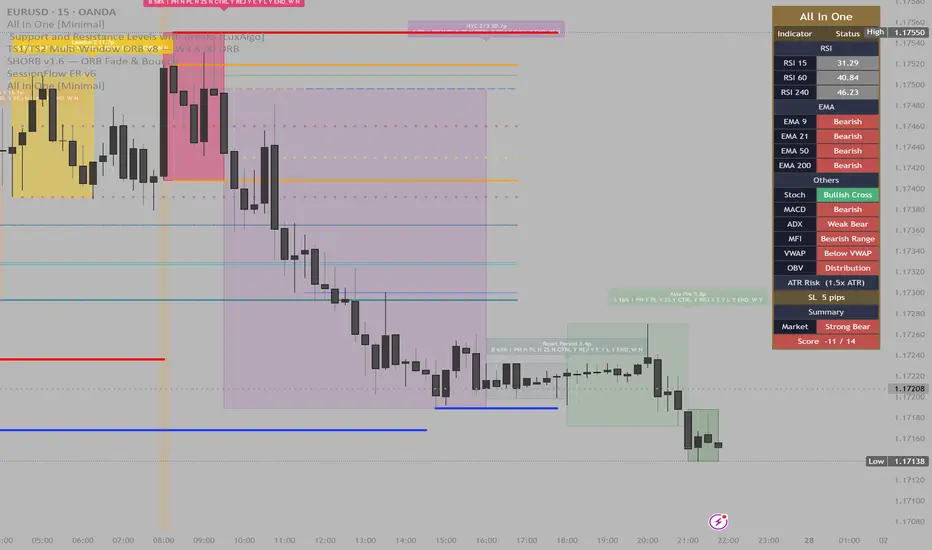
All In One [Minimal] — Free Multi-Timeframe Dashboard
This indicator consolidates 8 of the most widely used technical tools into a single clean overlay table, giving you a full market read at a glance without cluttering your chart with separate panes.
What's included:
RSI (3 timeframes) — Pulls RSI readings from your three chosen timeframes (default: 15m, 1H, 4H) simultaneously. Color-coded red for overbought (≥70), green for oversold (≤30), and neutral otherwise. Great for multi-timeframe confluence.
EMA Stack (4 periods) — Tracks price position relative to the 9, 21, 50, and 200 EMAs. Each shows a simple Bullish/Bearish read. When all four align, trend conviction is high.
Stochastic — Displays %K vs %D crossover status with overbought/oversold zones clearly labeled (Overbought, Oversold, Bullish Cross, Bearish Cross).
MACD — Shows whether the MACD line is above/below signal, and flags fresh crossovers in real time.
ADX (with DI±) — Identifies trend strength and direction. Readings above 25 are labeled Strong Bull or Strong Bear; below 25 are Weak Bull/Bear.
MFI (Money Flow Index) — Volume-weighted momentum. Flags overbought (≥80), oversold (≤20), and bullish/bearish ranges.
VWAP — Simple above/below read for intraday context.
OBV — Compares OBV to its EMA to detect accumulation vs distribution phases.
ATR-Based Risk Manager — Calculates a stop loss distance using ATR × multiplier (default 1.5×) and outputs it in pips/ticks, along with three take-profit targets at 1.5R, 2R, and 3R automatically.
Summary Score — All indicators vote bullish (+1) or bearish (−1). The total score out of 14 gives you an overall market bias label: Strong Bull, Bullish, Slightly Bullish, Neutral, and so on in the bearish direction.
Settings are fully customizable — every period, timeframe, and multiplier is adjustable from the inputs panel. Works on any instrument (forex, crypto, indices) and any timeframe.
No repainting. Overlay only — no extra panes needed.
This indicator consolidates 8 of the most widely used technical tools into a single clean overlay table, giving you a full market read at a glance without cluttering your chart with separate panes.
What's included:
RSI (3 timeframes) — Pulls RSI readings from your three chosen timeframes (default: 15m, 1H, 4H) simultaneously. Color-coded red for overbought (≥70), green for oversold (≤30), and neutral otherwise. Great for multi-timeframe confluence.
EMA Stack (4 periods) — Tracks price position relative to the 9, 21, 50, and 200 EMAs. Each shows a simple Bullish/Bearish read. When all four align, trend conviction is high.
Stochastic — Displays %K vs %D crossover status with overbought/oversold zones clearly labeled (Overbought, Oversold, Bullish Cross, Bearish Cross).
MACD — Shows whether the MACD line is above/below signal, and flags fresh crossovers in real time.
ADX (with DI±) — Identifies trend strength and direction. Readings above 25 are labeled Strong Bull or Strong Bear; below 25 are Weak Bull/Bear.
MFI (Money Flow Index) — Volume-weighted momentum. Flags overbought (≥80), oversold (≤20), and bullish/bearish ranges.
VWAP — Simple above/below read for intraday context.
OBV — Compares OBV to its EMA to detect accumulation vs distribution phases.
ATR-Based Risk Manager — Calculates a stop loss distance using ATR × multiplier (default 1.5×) and outputs it in pips/ticks, along with three take-profit targets at 1.5R, 2R, and 3R automatically.
Summary Score — All indicators vote bullish (+1) or bearish (−1). The total score out of 14 gives you an overall market bias label: Strong Bull, Bullish, Slightly Bullish, Neutral, and so on in the bearish direction.
Settings are fully customizable — every period, timeframe, and multiplier is adjustable from the inputs panel. Works on any instrument (forex, crypto, indices) and any timeframe.
No repainting. Overlay only — no extra panes needed.
Script de código abierto
Fiel al espíritu de TradingView, el creador de este script lo ha convertido en código abierto, para que los traders puedan revisar y verificar su funcionalidad. ¡Enhorabuena al autor! Aunque puede utilizarlo de forma gratuita, recuerde que cualquier republicación del código está sujeta a nuestras Normas internas.

Exención de responsabilidad
La información y las publicaciones no constituyen, ni deben considerarse como, asesoramiento o recomendaciones financieras, de inversión, de trading u otro tipo, proporcionadas o respaldadas por TradingView. Obtenga más información en Condiciones de uso.
Script de código abierto
Fiel al espíritu de TradingView, el creador de este script lo ha convertido en código abierto, para que los traders puedan revisar y verificar su funcionalidad. ¡Enhorabuena al autor! Aunque puede utilizarlo de forma gratuita, recuerde que cualquier republicación del código está sujeta a nuestras Normas internas.
Exención de responsabilidad
La información y las publicaciones no constituyen, ni deben considerarse como, asesoramiento o recomendaciones financieras, de inversión, de trading u otro tipo, proporcionadas o respaldadas por TradingView. Obtenga más información en Condiciones de uso.