Actualizado
EMA Ribbon [prof]
# EMA Ribbon [prof] —
## Overview
EMA Ribbon [prof] plots eight Exponential Moving Averages (EMAs) with staggered periods (default 24 down to 10) stacked on top of each other, forming a visual "ribbon" that reflects the current trend's direction and strength. When the eight lines are spread apart and neatly ordered, it signals a strong, clear trend; when the lines tangle and cross each other, it signals a choppy, range-bound market with no clear direction.
The indicator is designed to run directly on the price chart (overlay) and works on any market (stocks, forex, crypto, indices) and any timeframe.
## Key Features
- Eight EMAs with fully adjustable periods from the settings.
- Selectable price source (Close, High, Low, etc.) — defaults to High.
- "Drop first N candles" option to ignore a chosen number of the earliest candles before calculations start.
- "Offset" option to shift the ribbon left or right on the chart without affecting its underlying calculations.
- Automatic buy/sell signals (circles below/above the bar) triggered when price breaks through the entire ribbon to the upside or downside.
- Bar coloring (green/red) based on whether price is above or below the ribbon's midline, for quick at-a-glance trend reading.
- Full control over each line's color and thickness from the Style tab.
## How to Use It
- **Trend direction:** When price is above the ribbon and the lines are stacked with the shortest EMA on top, it supports a continuing uptrend; the mirror image supports a downtrend.
- **Trend strength:** The wider the gap between the lines, the stronger the momentum behind the move.
- **Dynamic support/resistance:** The ribbon itself can act as a dynamic support zone in an uptrend, or a dynamic resistance zone in a downtrend.
- **Signals:** The buy signal fires when price breaks above the highest point of the entire ribbon; the sell signal fires when price breaks below the lowest point. Treat these as additional confirmation, not standalone trade calls.
- It's best used alongside other tools (volume, support/resistance levels, momentum indicators) rather than relied on in isolation.
## Settings
| Setting | Description | Default |
|---|---|---|
| MA-1 to MA-8 period | Periods of the eight EMAs | 24, 22, 20, 18, 16, 14, 12, 10 |
| Source | Price source used for calculations | High |
| Drop first N candles | Number of leading candles excluded from calculations | 0 |
| Offset (Shift Ribbon) | Shifts the ribbon left/right on the chart | 8 |
| Show Buy/Sell Signals | Toggles the buy/sell signal markers | Enabled |
| Color Candles Above/Below Ribbon | Colors bars based on their position relative to the ribbon | Enabled |
## Disclaimer
This indicator is a technical analysis tool, not investment advice or a recommendation to buy or sell. Past performance does not guarantee future results. Users are solely responsible for their own trading decisions and should always apply independent risk and capital management before acting on any signal.
## Overview
EMA Ribbon [prof] plots eight Exponential Moving Averages (EMAs) with staggered periods (default 24 down to 10) stacked on top of each other, forming a visual "ribbon" that reflects the current trend's direction and strength. When the eight lines are spread apart and neatly ordered, it signals a strong, clear trend; when the lines tangle and cross each other, it signals a choppy, range-bound market with no clear direction.
The indicator is designed to run directly on the price chart (overlay) and works on any market (stocks, forex, crypto, indices) and any timeframe.
## Key Features
- Eight EMAs with fully adjustable periods from the settings.
- Selectable price source (Close, High, Low, etc.) — defaults to High.
- "Drop first N candles" option to ignore a chosen number of the earliest candles before calculations start.
- "Offset" option to shift the ribbon left or right on the chart without affecting its underlying calculations.
- Automatic buy/sell signals (circles below/above the bar) triggered when price breaks through the entire ribbon to the upside or downside.
- Bar coloring (green/red) based on whether price is above or below the ribbon's midline, for quick at-a-glance trend reading.
- Full control over each line's color and thickness from the Style tab.
## How to Use It
- **Trend direction:** When price is above the ribbon and the lines are stacked with the shortest EMA on top, it supports a continuing uptrend; the mirror image supports a downtrend.
- **Trend strength:** The wider the gap between the lines, the stronger the momentum behind the move.
- **Dynamic support/resistance:** The ribbon itself can act as a dynamic support zone in an uptrend, or a dynamic resistance zone in a downtrend.
- **Signals:** The buy signal fires when price breaks above the highest point of the entire ribbon; the sell signal fires when price breaks below the lowest point. Treat these as additional confirmation, not standalone trade calls.
- It's best used alongside other tools (volume, support/resistance levels, momentum indicators) rather than relied on in isolation.
## Settings
| Setting | Description | Default |
|---|---|---|
| MA-1 to MA-8 period | Periods of the eight EMAs | 24, 22, 20, 18, 16, 14, 12, 10 |
| Source | Price source used for calculations | High |
| Drop first N candles | Number of leading candles excluded from calculations | 0 |
| Offset (Shift Ribbon) | Shifts the ribbon left/right on the chart | 8 |
| Show Buy/Sell Signals | Toggles the buy/sell signal markers | Enabled |
| Color Candles Above/Below Ribbon | Colors bars based on their position relative to the ribbon | Enabled |
## Disclaimer
This indicator is a technical analysis tool, not investment advice or a recommendation to buy or sell. Past performance does not guarantee future results. Users are solely responsible for their own trading decisions and should always apply independent risk and capital management before acting on any signal.
Notas de prensa
upNotas de prensa
upNotas de prensa
Liquidity LevelsNotas de prensa
upNotas de prensa
upNotas de prensa
UP Notas de prensa
# EMA Ribbon + RSI + Liquidity + Golden Zone + Price MA — Beginner's GuideThis indicator combines five separate tools into one, so you get a full picture of trend, momentum, and key price levels without loading five different indicators on your chart. Each part can be turned on or off, and each has its own settings group in the indicator's Inputs panel. Here's what each one does and how to read it, explained from the ground up.
## 1. EMA Ribbon — trend direction and strength
An EMA (Exponential Moving Average) is a line that smooths out price by averaging recent candles, giving more weight to the latest ones. This indicator plots eight EMAs at once, with periods stepping down from 24 to 10 by default. Because they're plotted together, they form a "ribbon" — a band of lines instead of a single line.
How to read it: when all eight lines are spread apart and neatly stacked in order (shortest on top in an uptrend, or on the bottom in a downtrend), that's a strong, healthy trend. When the lines tangle and cross over each other, price is choppy or ranging, with no clear direction. The ribbon also acts like a dynamic support or resistance zone — price often reacts when it touches the ribbon.
Extra features: candles are colored green or red depending on whether price is above or below the ribbon's average line, and small circles mark "Buy" and "Sell" signals whenever price breaks through the entire ribbon (all eight lines) in one move.
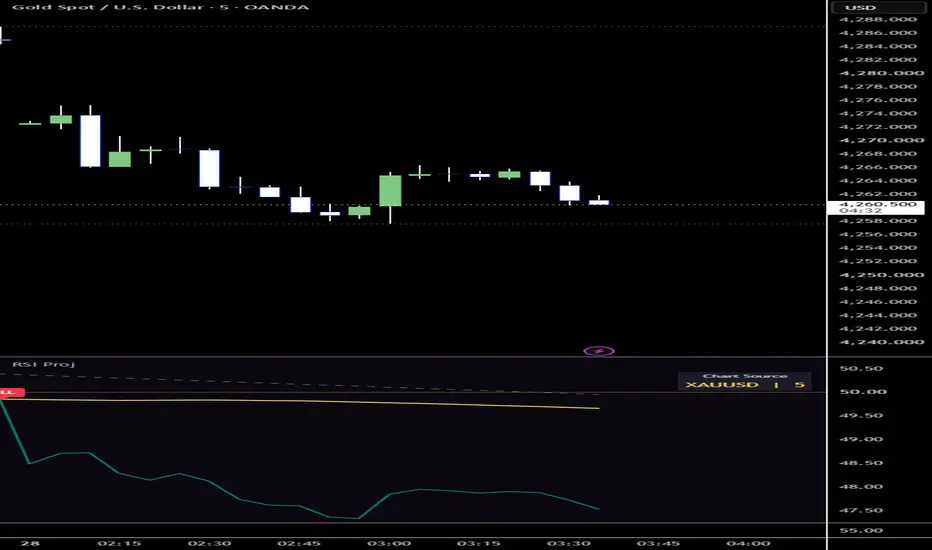
## 2. RSI on Chart — momentum, drawn directly on price
RSI (Relative Strength Index) is normally a separate oscillator below the chart, moving between 0 and 100, used to judge whether an asset is overbought or oversold. This indicator does something different: it mathematically converts the "RSI = 50" level into an equivalent price value and plots that as a line directly on your candles.
How to read it: when price is above this line, momentum leans bullish (the line turns green); when price is below it, momentum leans bearish (it turns red). You don't have to look at a separate RSI panel — this line reacts the same way, but sits right where the price action is.
## 3. Liquidity Levels — where the big volume traded
This part looks at trading volume, not price. It scans a set number of recent candles (the "Lookback" setting) and finds whichever one had the highest volume — meaning the most trading activity, often where large participants were active. That candle gets colored yellow so it stands out.
A horizontal line is then drawn at the midpoint of that high-volume candle ((high + low) / 2), colored green if price is currently above it or red if below. This level often behaves like a magnet or a decision point — price frequently returns to test it. The indicator can also fire an alert (with a small green or red dot on the chart) when price breaks above or opens below this level.
## 4. Golden Zone — the classic Fibonacci pullback area
This feature automatically finds the most recent significant swing high and swing low (confirmed pivots, based on the "Swing Lookback" setting), then calculates a Fibonacci retracement between them. It highlights the zone between the 38.2%–61.8%... specifically the 50% and 61.8% levels — widely known among traders as the "Golden Zone," because price often pulls back into this area before continuing its original move. It's commonly used to look for entries in the direction of the larger trend.
The zone is shaded (default: translucent yellow) and updates automatically as new swing points form, so you always see the most recent golden zone without manually drawing Fibonacci tools yourself.
## 5. Price MA on Chart — one flexible custom moving average
A simple, standalone moving average you can fully customize: choose the type (SMA, EMA, WMA, or RMA), the source price (default: High), the length (default: 88 — a longer-term trend reference), and even shift it forward in time with the Offset setting. Like the ribbon, it turns green when price is above it and red when price is below — useful as one clean, longer-term trend line layered on top of everything else.
## Alerts available
You can set TradingView alerts on this indicator without needing to watch the chart. Open "Create Alert," pick this indicator as the condition, and choose from:
- EMA Ribbon Breakout Up (Buy) / Breakout Down (Sell)
- RSI 50 Cross Up / Cross Down
- Liquidity Level Breakout Up (Buy) / Breakout Down (Sell)
## Quick settings reference
| Section | Key Inputs | What they control |
|---|---|---|
| EMA Ribbon | MA-1 to MA-8 period, Source, Offset | The 8 EMA lengths, price source, and how far the ribbon is shifted |
| RSI on Chart | RSI Period | How smooth/slow the RSI-as-price line reacts |
| Liquidity Levels | Lookback, Extend Bars, Bars to Check | How volume spikes are detected and how far the level line extends |
| Golden Zone | Swing Lookback | How many bars confirm a swing high/low pivot |
| Price MA on Chart | MA Length, MA Type, Offset | The custom moving average's length, formula, and shift |
## A note before you trade with it
This indicator is a technical analysis tool, not financial advice. It highlights trend, momentum, volume, and common retracement zones, but none of these guarantee future price movement. Always combine it with your own risk management and, ideally, other confirmation before acting on any signal.
Notas de prensa
upNotas de prensa
upNotas de prensa
up cloud Notas de prensa
up
Exención de responsabilidad
La información y las publicaciones no constituyen, ni deben considerarse como, asesoramiento o recomendaciones financieras, de inversión, de trading u otro tipo, proporcionadas o respaldadas por TradingView. Obtenga más información en Condiciones de uso.
Exención de responsabilidad
La información y las publicaciones no constituyen, ni deben considerarse como, asesoramiento o recomendaciones financieras, de inversión, de trading u otro tipo, proporcionadas o respaldadas por TradingView. Obtenga más información en Condiciones de uso.