Trading-Sparks - Session Hour Stats
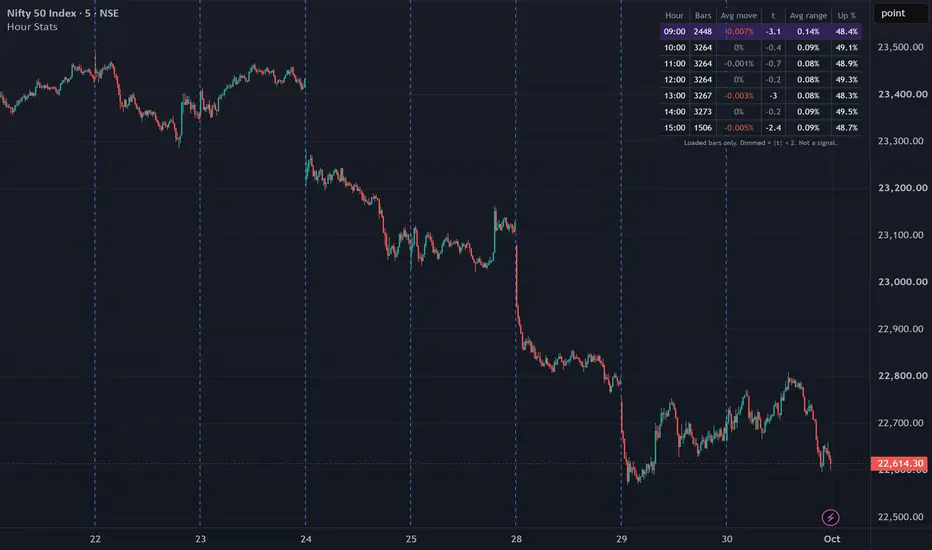
Session Hour Stats splits the bars on your intraday chart by hour of the day and reports, for each hour, how the average bar in that hour has behaved over the loaded history.
What it shows
For every hour between the first and last hour you choose, one row with:
- Bars: how many bars fell in that hour.
- Avg move: the mean open-to-close change of those bars, as a percent of the open.
- t: the average move divided by its standard error, mean / (stdev / sqrt(n)).
- Avg range: the mean high-to-low range, as a percent of the open.
- Up %: the share of bars in that hour that closed above their open.
The hour with the largest average range is highlighted.
How it works
Each confirmed bar is assigned to an hour using the timezone you set, and its move, squared move, range and direction are added to that hour's totals. Nothing is counted until a bar closes, so the table does not change for past bars and the live bar is excluded until it completes.
Why the t column
An hourly average such as +0.03% looks like a bias until you compare it with how noisy individual bars are in that hour. The t value does that comparison. As a rough guide, when the absolute value of t is below 2 the average cannot be distinguished from zero on this sample, and the Avg move and t cells are dimmed. This is what separates the table from a plain average-by-hour display: it tells you which hourly differences are large enough to take seriously and which are likely noise.
How to use it
- Use it on an intraday chart between 1 minute and 1 hour. On daily and above it shows a note instead.
- Set the timezone to the exchange's: Asia/Kolkata for NSE and MCX, America/New_York for US equities, Etc/UTC for most crypto.
- Load as much history as your account allows; the Bars column tells you how much evidence each row rests on.
- Typical questions it answers: does the range concentrate in the first hour? Is there a consistent drift in the last hour? Is an apparent lunchtime bias real or noise?
Limitations
- It describes the bars currently loaded, which is a sample of the past, not a forecast.
- The t value assumes bars are independent, which intraday bars are not entirely; treat it as a screening guide, not a formal test.
- It produces no signals and should not be used as one on its own.
What it shows
For every hour between the first and last hour you choose, one row with:
- Bars: how many bars fell in that hour.
- Avg move: the mean open-to-close change of those bars, as a percent of the open.
- t: the average move divided by its standard error, mean / (stdev / sqrt(n)).
- Avg range: the mean high-to-low range, as a percent of the open.
- Up %: the share of bars in that hour that closed above their open.
The hour with the largest average range is highlighted.
How it works
Each confirmed bar is assigned to an hour using the timezone you set, and its move, squared move, range and direction are added to that hour's totals. Nothing is counted until a bar closes, so the table does not change for past bars and the live bar is excluded until it completes.
Why the t column
An hourly average such as +0.03% looks like a bias until you compare it with how noisy individual bars are in that hour. The t value does that comparison. As a rough guide, when the absolute value of t is below 2 the average cannot be distinguished from zero on this sample, and the Avg move and t cells are dimmed. This is what separates the table from a plain average-by-hour display: it tells you which hourly differences are large enough to take seriously and which are likely noise.
How to use it
- Use it on an intraday chart between 1 minute and 1 hour. On daily and above it shows a note instead.
- Set the timezone to the exchange's: Asia/Kolkata for NSE and MCX, America/New_York for US equities, Etc/UTC for most crypto.
- Load as much history as your account allows; the Bars column tells you how much evidence each row rests on.
- Typical questions it answers: does the range concentrate in the first hour? Is there a consistent drift in the last hour? Is an apparent lunchtime bias real or noise?
Limitations
- It describes the bars currently loaded, which is a sample of the past, not a forecast.
- The t value assumes bars are independent, which intraday bars are not entirely; treat it as a screening guide, not a formal test.
- It produces no signals and should not be used as one on its own.

Exención de responsabilidad
La información y las publicaciones no constituyen, ni deben considerarse como, asesoramiento o recomendaciones financieras, de inversión, de trading u otro tipo, proporcionadas o respaldadas por TradingView. Obtenga más información en Condiciones de uso.
Exención de responsabilidad
La información y las publicaciones no constituyen, ni deben considerarse como, asesoramiento o recomendaciones financieras, de inversión, de trading u otro tipo, proporcionadas o respaldadas por TradingView. Obtenga más información en Condiciones de uso.