SPY Auction Intelligence v4 - Hierarchical Quant
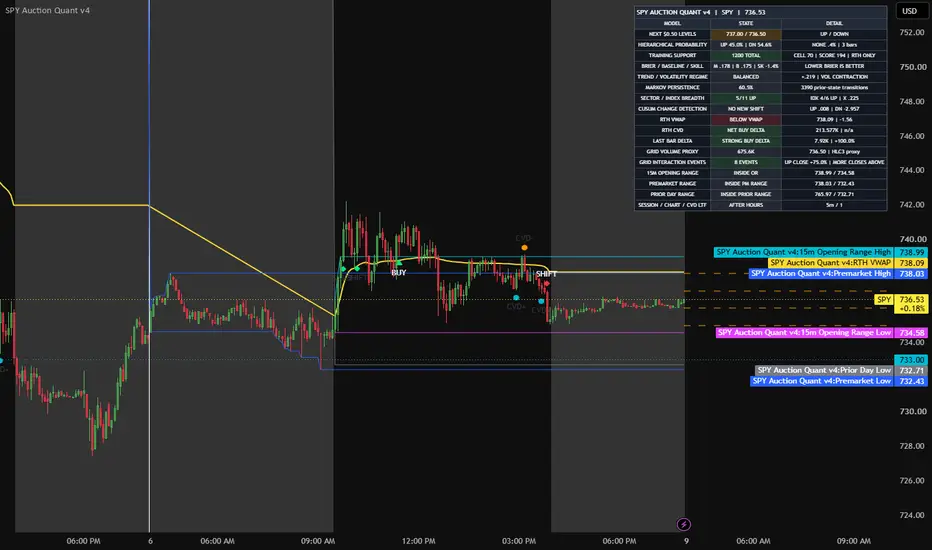
# SPY Auction Intelligence V4 – Hierarchical Quant
**A multi-dimensional SPY auction analysis system built around the $0.50 price grid.**
SPY Auction Intelligence V4 combines price structure, volume delta, market breadth, cross-market confirmation and quantitative statistical models into one comprehensive TradingView indicator.
Designed for traders who want to understand the auction behind SPY's price movements, this indicator places the $0.50 price grid at the centre of its analysis. It examines how price interacts with important levels, evaluates buying and selling pressure, identifies changing market conditions and estimates the historical probability of reaching the next upper or lower grid level first.
Rather than relying on conventional indicator signals alone, V4 brings together multiple forms of market information to provide a broader, structured view of intraday market behaviour.
## KEY FEATURES
### 1. $0.50 Auction Grid Intelligence
- Configurable price-grid increments.
- Automatic identification of adjacent grid levels.
- Grid proximity and interaction detection.
- Developing grid-volume profile proxy.
- Distinct grid interaction event tracking.
- Above/below closing behaviour at individual levels.
- Dynamic chart grid visualization.
### 2. Hierarchical Bayesian Probability Engine
- Three possible forecast outcomes: upper level first, lower level first, or neither.
- Nine directional score categories.
- Three independently classified market regimes.
- Hierarchical probability estimation using global, score-level and regime-specific historical observations.
- Bayesian-style smoothing to reduce unreliable estimates from small samples.
- Non-overlapping forecast evaluation.
- Configurable forecast horizon and historical sample limits.
The probability engine learns from resolved historical observations on the chart. Its estimates are conditional historical frequencies with hierarchical smoothing, not guarantees of future performance.
### 3. Quantitative Model Validation
- Sequential multiclass Brier scoring.
- Comparison against an unconditional historical baseline.
- Brier skill measurement.
- Rolling resolved-observation tracking.
- Separate counts for score categories and market-regime combinations.
- Exclusion of ambiguous same-bar outcomes.
These measurements help evaluate whether the model has historically added value beyond a simple baseline.
### 4. Order-Flow Analysis
- Cumulative volume delta.
- Lower-timeframe volume-delta calculations.
- Current-bar delta and delta percentage.
- Regular-session cumulative delta.
- Bullish and bearish CVD divergence candidates.
- Potential buying and selling response candidates near grid levels.
### 5. Eleven-Sector Market Confirmation
Monitors all 11 S&P sector ETFs:
XLK, XLF, XLY, XLP, XLE, XLI, XLB, XLV, XLU, XLRE and XLC.
Additional market instruments:
- QQQ
- DIA
- IWM
- ES futures
- NQ futures
- YM futures
Sector and index/futures direction are combined into a cross-market confirmation feature.
### 6. Market Regime and Statistical Analysis
- Trend-efficiency classification.
- Bullish, bearish and balanced market states.
- Smoothed Markov regime-transition analysis.
- CUSUM directional change detection.
- ATR-based volatility analysis.
- Volatility expansion and contraction.
- Relative volume.
- Return Z-score.
- Normalized directional feature scoring.
### 7. Intraday Market Structure
- Regular-session VWAP.
- Premarket high and low.
- 15-minute opening-range high and low.
- Developing regular-session high and low.
- Previous daily high and low.
- Session-aware calculations.
### 8. Dashboard and Alerts
A consolidated dashboard displays the primary auction, probability, statistical, order-flow and cross-market measurements.
Configurable alerts include:
- Potential grid buying response.
- Potential grid selling response.
- Bullish and bearish CVD divergence.
- Bullish and bearish CUSUM shifts.
- Upper-grid probability threshold.
- Lower-grid probability threshold.
## DESIGNED FOR
- SPY intraday traders.
- Short-duration options traders.
- Auction-market analysis.
- Price-level and grid-based trading.
- Volume-delta and VWAP analysis.
- Traders interested in statistical market modelling.
- Traders seeking broader index and sector confirmation.
## RECOMMENDED CONFIGURATION
The indicator is designed for intraday charts of 15 minutes or lower.
The 5-minute SPY chart is a recommended starting point. The default forecast horizon is three chart bars, so the actual forecast duration depends on the selected chart timeframe.
The $0.50 grid is the default central reference, with configurable settings available.
## IMPORTANT METHODOLOGY NOTES
This indicator uses chart-based volume and lower-timeframe volume-delta estimates. Grid volume is a bar-volume allocation proxy rather than exact transaction-level volume-at-price.
Cross-market confirmation measures directional instrument changes; it is not equivalent to NYSE advance/decline breadth or order-book analysis.
The probability engine uses historical chart observations and manually configured feature weights and prior strengths. It is not an automatically trained machine-learning system, and its historical estimates should not be interpreted as guaranteed predictive accuracy.
## DISCLAIMER
This indicator is an analytical and educational tool. It does not provide financial advice or guaranteed trading signals. Historical statistical outcomes do not guarantee future results. Trading stocks and options involves substantial risk, including the possible loss of capital. Independent testing, risk management and trade execution considerations remain the user's responsibility.
**SPY Auction Intelligence V4 — Price First. Auction Context. Quantitative Evidence.**
**A multi-dimensional SPY auction analysis system built around the $0.50 price grid.**
SPY Auction Intelligence V4 combines price structure, volume delta, market breadth, cross-market confirmation and quantitative statistical models into one comprehensive TradingView indicator.
Designed for traders who want to understand the auction behind SPY's price movements, this indicator places the $0.50 price grid at the centre of its analysis. It examines how price interacts with important levels, evaluates buying and selling pressure, identifies changing market conditions and estimates the historical probability of reaching the next upper or lower grid level first.
Rather than relying on conventional indicator signals alone, V4 brings together multiple forms of market information to provide a broader, structured view of intraday market behaviour.
## KEY FEATURES
### 1. $0.50 Auction Grid Intelligence
- Configurable price-grid increments.
- Automatic identification of adjacent grid levels.
- Grid proximity and interaction detection.
- Developing grid-volume profile proxy.
- Distinct grid interaction event tracking.
- Above/below closing behaviour at individual levels.
- Dynamic chart grid visualization.
### 2. Hierarchical Bayesian Probability Engine
- Three possible forecast outcomes: upper level first, lower level first, or neither.
- Nine directional score categories.
- Three independently classified market regimes.
- Hierarchical probability estimation using global, score-level and regime-specific historical observations.
- Bayesian-style smoothing to reduce unreliable estimates from small samples.
- Non-overlapping forecast evaluation.
- Configurable forecast horizon and historical sample limits.
The probability engine learns from resolved historical observations on the chart. Its estimates are conditional historical frequencies with hierarchical smoothing, not guarantees of future performance.
### 3. Quantitative Model Validation
- Sequential multiclass Brier scoring.
- Comparison against an unconditional historical baseline.
- Brier skill measurement.
- Rolling resolved-observation tracking.
- Separate counts for score categories and market-regime combinations.
- Exclusion of ambiguous same-bar outcomes.
These measurements help evaluate whether the model has historically added value beyond a simple baseline.
### 4. Order-Flow Analysis
- Cumulative volume delta.
- Lower-timeframe volume-delta calculations.
- Current-bar delta and delta percentage.
- Regular-session cumulative delta.
- Bullish and bearish CVD divergence candidates.
- Potential buying and selling response candidates near grid levels.
### 5. Eleven-Sector Market Confirmation
Monitors all 11 S&P sector ETFs:
XLK, XLF, XLY, XLP, XLE, XLI, XLB, XLV, XLU, XLRE and XLC.
Additional market instruments:
- QQQ
- DIA
- IWM
- ES futures
- NQ futures
- YM futures
Sector and index/futures direction are combined into a cross-market confirmation feature.
### 6. Market Regime and Statistical Analysis
- Trend-efficiency classification.
- Bullish, bearish and balanced market states.
- Smoothed Markov regime-transition analysis.
- CUSUM directional change detection.
- ATR-based volatility analysis.
- Volatility expansion and contraction.
- Relative volume.
- Return Z-score.
- Normalized directional feature scoring.
### 7. Intraday Market Structure
- Regular-session VWAP.
- Premarket high and low.
- 15-minute opening-range high and low.
- Developing regular-session high and low.
- Previous daily high and low.
- Session-aware calculations.
### 8. Dashboard and Alerts
A consolidated dashboard displays the primary auction, probability, statistical, order-flow and cross-market measurements.
Configurable alerts include:
- Potential grid buying response.
- Potential grid selling response.
- Bullish and bearish CVD divergence.
- Bullish and bearish CUSUM shifts.
- Upper-grid probability threshold.
- Lower-grid probability threshold.
## DESIGNED FOR
- SPY intraday traders.
- Short-duration options traders.
- Auction-market analysis.
- Price-level and grid-based trading.
- Volume-delta and VWAP analysis.
- Traders interested in statistical market modelling.
- Traders seeking broader index and sector confirmation.
## RECOMMENDED CONFIGURATION
The indicator is designed for intraday charts of 15 minutes or lower.
The 5-minute SPY chart is a recommended starting point. The default forecast horizon is three chart bars, so the actual forecast duration depends on the selected chart timeframe.
The $0.50 grid is the default central reference, with configurable settings available.
## IMPORTANT METHODOLOGY NOTES
This indicator uses chart-based volume and lower-timeframe volume-delta estimates. Grid volume is a bar-volume allocation proxy rather than exact transaction-level volume-at-price.
Cross-market confirmation measures directional instrument changes; it is not equivalent to NYSE advance/decline breadth or order-book analysis.
The probability engine uses historical chart observations and manually configured feature weights and prior strengths. It is not an automatically trained machine-learning system, and its historical estimates should not be interpreted as guaranteed predictive accuracy.
## DISCLAIMER
This indicator is an analytical and educational tool. It does not provide financial advice or guaranteed trading signals. Historical statistical outcomes do not guarantee future results. Trading stocks and options involves substantial risk, including the possible loss of capital. Independent testing, risk management and trade execution considerations remain the user's responsibility.
**SPY Auction Intelligence V4 — Price First. Auction Context. Quantitative Evidence.**

Exención de responsabilidad
La información y las publicaciones no constituyen, ni deben considerarse como, asesoramiento o recomendaciones financieras, de inversión, de trading u otro tipo, proporcionadas o respaldadas por TradingView. Obtenga más información en Condiciones de uso.
Exención de responsabilidad
La información y las publicaciones no constituyen, ni deben considerarse como, asesoramiento o recomendaciones financieras, de inversión, de trading u otro tipo, proporcionadas o respaldadas por TradingView. Obtenga más información en Condiciones de uso.