Seasonality - Day of Week & Hour of Day Statistics [Dots3Red]
📅 SEASONALITY - DAY OF WEEK & HOUR OF DAY STATISTICS [Dots3Red]
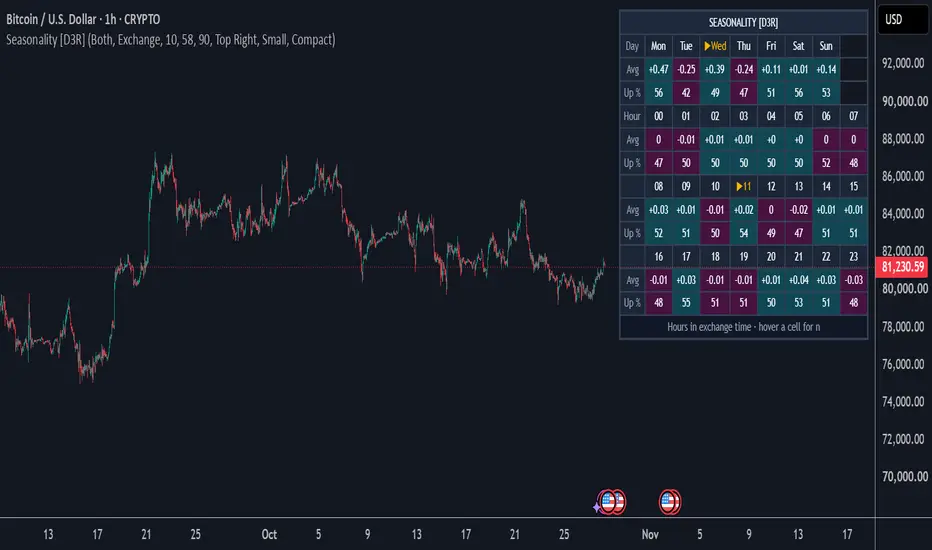
This indicator measures how the current instrument has historically behaved on each day of the week and during each hour of the day, showing the average return, the share of up periods and the sample size for every bucket in a heatmap table.
✨ WHY THIS MATTERS
Markets have rhythms. Some instruments tend to drift up on certain weekdays, some hours are reliably volatile or quiet, and some sessions lean one way more often than chance would suggest. Traders often rely on hunches about this ("Mondays are weak", "the first hour is a trap"). This script replaces the "assumption" with numbers from the chart's own history, broken down bucket by bucket.
⚙️ HOW IT WORKS
📅 Day of week — each completed trading day's return (close to previous close) is filed under its weekday. For each weekday you see the average return, the percentage of up days, and how many days were counted.
🕐 Hour of day — on charts of one hour or lower, each completed hour's return (from the hour's first open to its last close) is filed under that hour, in the timezone you choose.
🌡️ Heatmap table, two layouts
• Compact (default) — weekdays across one block and the 24 hours in three rows of eight, so the whole table fits on screen even on low timeframes. Hover any cell to see its sample size.
• Tall — one row per bucket with average return, up % and sample size side by side.
Cells are colored by whether the average return is positive or negative, and the current weekday and hour are marked with ▶.
🎨 Strong / weak hour highlight — optionally tints the chart background during hours whose up-rate so far is at or above your threshold (strong) or at or below its mirror (weak). The highlight on any past bar only uses data that existed at that time.
🔒 Non-repainting — every day and hour is recorded once, after it has fully closed. Nothing is recalculated with hindsight.
Example of Tall Layout

🧭 HOW TO USE
1️⃣ Look at Up % and Avg together. A bucket that is up 60% of the time with a small positive average is different from one that is up only 45% of the time but has a large average driven by a few big moves.
2️⃣ Check the sample size. A bucket with 12 samples can be pure chance. Buckets show "—" until they reach your minimum.
3️⃣ Use it for timing, not direction alone. Knowing which hours tend to move and which tend to drift helps decide when to be active and when to step back.
4️⃣ Set the timezone that matches how you think about the session. Exchange time for stocks and futures, UTC or a regional zone for forex and crypto.
5️⃣ Use it as context. Seasonal tendencies are averages. They describe the past and can weaken or disappear.
⏱️ WHICH TIMEFRAMES WORK BEST
Day-of-week statistics work on daily and intraday charts. Hour-of-day statistics need a chart of 1 hour or lower; 5-minute to 1-hour charts give the best balance between history depth and resolution.
🛠️ SETTINGS
📅 Seasonality — show day of week, hour of day or both; hour timezone; minimum samples per bucket
🎨 Visuals — positive and negative colors, strong/weak hour highlight, strong-hour threshold, highlight transparency
🖥️ Dashboard — show/hide, position, text size, layout (compact or tall)
🔔 Alerts — historically strong hour started, historically weak hour started
📝 NOTES
Results depend on how much history the chart loads. Intraday charts load fewer days than daily charts, so day-of-week numbers on an intraday chart cover a shorter period. On a 1-hour chart of a session that opens on the half hour, each bar is filed under the hour it starts in. All statistics are specific to this chart and settings, and do not transfer to other instruments.
⚠️ DISCLAIMER
This is an analytical and visualization tool. It does not generate trade signals and does not constitute financial advice. Historical statistics do not guarantee future performance.
This indicator measures how the current instrument has historically behaved on each day of the week and during each hour of the day, showing the average return, the share of up periods and the sample size for every bucket in a heatmap table.
✨ WHY THIS MATTERS
Markets have rhythms. Some instruments tend to drift up on certain weekdays, some hours are reliably volatile or quiet, and some sessions lean one way more often than chance would suggest. Traders often rely on hunches about this ("Mondays are weak", "the first hour is a trap"). This script replaces the "assumption" with numbers from the chart's own history, broken down bucket by bucket.
⚙️ HOW IT WORKS
📅 Day of week — each completed trading day's return (close to previous close) is filed under its weekday. For each weekday you see the average return, the percentage of up days, and how many days were counted.
🕐 Hour of day — on charts of one hour or lower, each completed hour's return (from the hour's first open to its last close) is filed under that hour, in the timezone you choose.
🌡️ Heatmap table, two layouts
• Compact (default) — weekdays across one block and the 24 hours in three rows of eight, so the whole table fits on screen even on low timeframes. Hover any cell to see its sample size.
• Tall — one row per bucket with average return, up % and sample size side by side.
Cells are colored by whether the average return is positive or negative, and the current weekday and hour are marked with ▶.
🎨 Strong / weak hour highlight — optionally tints the chart background during hours whose up-rate so far is at or above your threshold (strong) or at or below its mirror (weak). The highlight on any past bar only uses data that existed at that time.
🔒 Non-repainting — every day and hour is recorded once, after it has fully closed. Nothing is recalculated with hindsight.
Example of Tall Layout
🧭 HOW TO USE
1️⃣ Look at Up % and Avg together. A bucket that is up 60% of the time with a small positive average is different from one that is up only 45% of the time but has a large average driven by a few big moves.
2️⃣ Check the sample size. A bucket with 12 samples can be pure chance. Buckets show "—" until they reach your minimum.
3️⃣ Use it for timing, not direction alone. Knowing which hours tend to move and which tend to drift helps decide when to be active and when to step back.
4️⃣ Set the timezone that matches how you think about the session. Exchange time for stocks and futures, UTC or a regional zone for forex and crypto.
5️⃣ Use it as context. Seasonal tendencies are averages. They describe the past and can weaken or disappear.
⏱️ WHICH TIMEFRAMES WORK BEST
Day-of-week statistics work on daily and intraday charts. Hour-of-day statistics need a chart of 1 hour or lower; 5-minute to 1-hour charts give the best balance between history depth and resolution.
🛠️ SETTINGS
📅 Seasonality — show day of week, hour of day or both; hour timezone; minimum samples per bucket
🎨 Visuals — positive and negative colors, strong/weak hour highlight, strong-hour threshold, highlight transparency
🖥️ Dashboard — show/hide, position, text size, layout (compact or tall)
🔔 Alerts — historically strong hour started, historically weak hour started
📝 NOTES
Results depend on how much history the chart loads. Intraday charts load fewer days than daily charts, so day-of-week numbers on an intraday chart cover a shorter period. On a 1-hour chart of a session that opens on the half hour, each bar is filed under the hour it starts in. All statistics are specific to this chart and settings, and do not transfer to other instruments.
⚠️ DISCLAIMER
This is an analytical and visualization tool. It does not generate trade signals and does not constitute financial advice. Historical statistics do not guarantee future performance.

Connect the dots to elevate your trading.
Exención de responsabilidad
La información y las publicaciones no constituyen, ni deben considerarse como, asesoramiento o recomendaciones financieras, de inversión, de trading u otro tipo, proporcionadas o respaldadas por TradingView. Obtenga más información en Condiciones de uso.
Connect the dots to elevate your trading.
Exención de responsabilidad
La información y las publicaciones no constituyen, ni deben considerarse como, asesoramiento o recomendaciones financieras, de inversión, de trading u otro tipo, proporcionadas o respaldadas por TradingView. Obtenga más información en Condiciones de uso.