OPEN-SOURCE SCRIPT
Structure Fracture Map [JOAT]
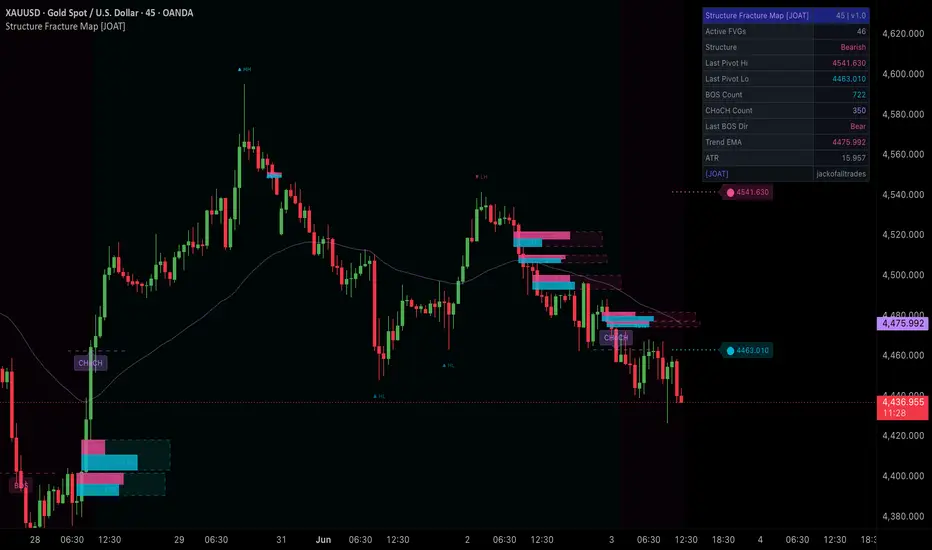
Structure Fracture Map is an open-source market structure and imbalance zone indicator that combines Fair Value Gap detection with a dynamic quality scoring system, a dual strength bar visualization inside each zone, and a real-time Break of Structure and Change of Character engine. It provides a single-indicator view of where price has left imbalances, how significant those imbalances are, and where structural shifts have occurred.
The problem with most FVG indicators is static treatment — a gap is detected and displayed with no differentiation between a high-quality gap formed on a strong impulse with above-average volume and a weak gap formed on a low-volume, narrow-range bar. Structure Fracture Map scores every FVG at formation and continuously updates that score based on mitigation progress, age, and trend alignment, ranking all active zones so that only the most institutionally relevant ones remain visible.

Core Concepts
1. Fair Value Gap Detection
A bullish FVG exists when the current bar's low is above the high of the bar two positions prior — a three-bar pattern where the middle bar's range creates a gap that price has not filled. A bearish FVG is the inverse. Detection is confirmed only on completed bars to prevent repainting.
2. Four-Component Strength Score
Each FVG receives an initial strength score from four components: gap size relative to ATR(14) scaled to 40 points, volume relative to 20-bar average scaled to 30 points, trend EMA alignment scaled to 20 points, and candle body-to-range ratio scaled to 10 points. The score is recalculated every bar, with a small age penalty and a mitigation penalty applied as price partially fills the gap:
Pine Script®
3. Dual Strength Bars
Inside each FVG box, two small bars are rendered — one showing bearish pressure score and one showing bullish pressure score as a proportion of the box width. The relative lengths reflect which directional force is currently dominating at that imbalance zone.
4. Mitigation Tracking
Mitigation is computed as the ratio of how far price has penetrated into the zone to the total zone height. A fully mitigated FVG is removed from the display. Partially mitigated FVGs remain visible with their score updated downward, reflecting reduced structural significance.
5. Break of Structure and Change of Character
Pivot highs and lows track the most recent confirmed structural levels. A Break of Structure (BOS) occurs when price closes through the last confirmed pivot in the current structural direction — confirming continuation. A Change of Character (CHoCH) occurs when price closes through the last confirmed pivot against the current direction — signaling a potential structural shift. Both events are labeled with a horizontal line at the break level.

Features
Input Parameters
FVG Zones:
Market Structure:
How to Use This Indicator
Step 1: Read Zone Rankings
Zones with higher quality scores represent structurally more significant imbalances. Focus on fresh (un-mitigated) zones with strong scores for potential reaction areas.
Step 2: Monitor Dual Strength Bars
A bullish FVG whose bearish strength bar is growing indicates that selling pressure is building within the zone. When the bearish bar exceeds the bullish bar, the zone may be losing its bullish character.
Step 3: Use BOS and CHoCH for Context
A BOS confirms continuation. A CHoCH is a warning that the current structural bias may be reversing. CHoCH events near high-quality FVG zones are particularly significant structural signals.
Step 4: Watch Swing Level Extensions
The dotted right-edge lines show the nearest unbroken swing high and low — the next levels where a BOS or CHoCH could occur. These levels frame the most immediate structural breakpoints.
Indicator Limitations
Originality Statement
Disclaimer
This indicator is provided for educational and informational purposes only. It is not financial advice. Trading involves substantial risk of loss. Fair Value Gaps and structural events are based on historical price data and do not predict future price direction. The author accepts no responsibility for trading losses resulting from use of this indicator.
Made with passion by jackofalltrades
The problem with most FVG indicators is static treatment — a gap is detected and displayed with no differentiation between a high-quality gap formed on a strong impulse with above-average volume and a weak gap formed on a low-volume, narrow-range bar. Structure Fracture Map scores every FVG at formation and continuously updates that score based on mitigation progress, age, and trend alignment, ranking all active zones so that only the most institutionally relevant ones remain visible.
Core Concepts
1. Fair Value Gap Detection
A bullish FVG exists when the current bar's low is above the high of the bar two positions prior — a three-bar pattern where the middle bar's range creates a gap that price has not filled. A bearish FVG is the inverse. Detection is confirmed only on completed bars to prevent repainting.
2. Four-Component Strength Score
Each FVG receives an initial strength score from four components: gap size relative to ATR(14) scaled to 40 points, volume relative to 20-bar average scaled to 30 points, trend EMA alignment scaled to 20 points, and candle body-to-range ratio scaled to 10 points. The score is recalculated every bar, with a small age penalty and a mitigation penalty applied as price partially fills the gap:
3. Dual Strength Bars
Inside each FVG box, two small bars are rendered — one showing bearish pressure score and one showing bullish pressure score as a proportion of the box width. The relative lengths reflect which directional force is currently dominating at that imbalance zone.
4. Mitigation Tracking
Mitigation is computed as the ratio of how far price has penetrated into the zone to the total zone height. A fully mitigated FVG is removed from the display. Partially mitigated FVGs remain visible with their score updated downward, reflecting reduced structural significance.
5. Break of Structure and Change of Character
Pivot highs and lows track the most recent confirmed structural levels. A Break of Structure (BOS) occurs when price closes through the last confirmed pivot in the current structural direction — confirming continuation. A Change of Character (CHoCH) occurs when price closes through the last confirmed pivot against the current direction — signaling a potential structural shift. Both events are labeled with a horizontal line at the break level.
Features
- FVG detection with quality scoring: Bullish and bearish fair value gaps detected and scored by gap size, volume, trend alignment, and candle quality
- Dynamic score updates: Quality scores recalculated each bar with age decay and mitigation penalty
- Top-N zone ranking: Only the highest-scoring active zones displayed; lower-quality zones removed as better ones form
- Dual strength bars: Bearish and bullish strength bars inside each zone show directional pressure balance
- Mitigation tracking: Zones removed automatically when fully mitigated; partial mitigation reflected in updated score
- BOS and CHoCH detection: Structural break events labeled with horizontal level lines and text identifiers
- HH / HL / LH / LL pivot labels: Confirmed swing pivot types labeled on chart for structural context
- Swing level extension lines: Dotted lines at current unbroken swing levels extending to right edge of chart
- Four color themes: Phantom, Neon, Classic, Solar
- Non-repainting: All detection gated by barstate.isconfirmed
- Alert conditions: New top-ranked FVG, BOS bull, BOS bear, CHoCH bull, CHoCH bear, FVG touched
- Dashed FVG borders: Each Fair Value Gap box has a dashed colored border matching its directional bias — teal for bullish, pink for bearish
- Clean pivot arrow labels: HH, HL, LH, LL events rendered as minimal text arrows (▲ HH etc.) with no background box, positioned above/below bars without obstructing price action
- Short BOS/CHoCH event lines: Break of Structure and Change of Character events marked with compact 6-bar horizontal lines and right-anchored labels — no full-width horizontal clutter
- Resistance/Support swing extensions: Nearest unbroken swing high labeled "Res" and swing low labeled "Sup" at right edge, updated each bar
- Structural bias background: Subtle bull/bear background tint driven by current HH/HL or LH/LL structural sequence
- Trend EMA reference line: 50-period EMA plotted in elite theme color as a trend context reference
Input Parameters
FVG Zones:
- Show Top Zones: Maximum number of ranked zones displayed (default: 10)
- Max Stored FVGs: Maximum FVGs tracked in memory (default: 50)
- Volume MA Length: Volume average for scoring (default: 20)
- Trend EMA Length: Trend alignment reference (default: 50)
- Show Strength Bars toggle
- Bull/Bear FVG colors
Market Structure:
- Swing Lookback: Bars required on each side for pivot confirmation (default: 10)
- Show Structure Labels toggle
- Show BOS Events toggle
- Show CHoCH Events toggle
- Show Swing Level Lines toggle
How to Use This Indicator
Step 1: Read Zone Rankings
Zones with higher quality scores represent structurally more significant imbalances. Focus on fresh (un-mitigated) zones with strong scores for potential reaction areas.
Step 2: Monitor Dual Strength Bars
A bullish FVG whose bearish strength bar is growing indicates that selling pressure is building within the zone. When the bearish bar exceeds the bullish bar, the zone may be losing its bullish character.
Step 3: Use BOS and CHoCH for Context
A BOS confirms continuation. A CHoCH is a warning that the current structural bias may be reversing. CHoCH events near high-quality FVG zones are particularly significant structural signals.
Step 4: Watch Swing Level Extensions
The dotted right-edge lines show the nearest unbroken swing high and low — the next levels where a BOS or CHoCH could occur. These levels frame the most immediate structural breakpoints.
Indicator Limitations
- Pivot confirmation requires a lookback offset. BOS and CHoCH events are labeled after confirmation, not on the bar that caused them
- FVG quality scores include volume as a factor. On instruments where volume is less meaningful, the score may rank gaps differently than expected
- Age penalty causes long-standing FVGs to lose score over time even if they remain structurally valid
- This indicator identifies existing imbalances and structural events. It does not predict where price will go next
Originality Statement
- A dynamic per-bar quality score for FVGs that decays with age and mitigation, combined with a top-N ranking system that actively removes lower-quality zones when better ones form, is not replicated in existing open-source Pine Script v6 FVG publications
- Dual strength bars rendered inside each FVG box — showing the current bull-versus-bear directional pressure balance within that specific imbalance zone — is an original visualization concept
- Combining FVG quality ranking, mitigation tracking, BOS/CHoCH structural event detection, and pivot type labeling in a unified indicator with a single clean overlay is an original integration
Disclaimer
This indicator is provided for educational and informational purposes only. It is not financial advice. Trading involves substantial risk of loss. Fair Value Gaps and structural events are based on historical price data and do not predict future price direction. The author accepts no responsibility for trading losses resulting from use of this indicator.
Made with passion by jackofalltrades
Script de código abierto
Fiel al espíritu de TradingView, el creador de este script lo ha convertido en código abierto, para que los traders puedan revisar y verificar su funcionalidad. ¡Enhorabuena al autor! Aunque puede utilizarlo de forma gratuita, recuerde que cualquier republicación del código está sujeta a nuestras Normas internas.

The Institutional Grade Trading Ecosystem, Built to win trades 📈
Get Access 👇
jackofalltrades.vip 🌐
t.me/jackofalltradesvip 🃏
Get Access 👇
jackofalltrades.vip 🌐
t.me/jackofalltradesvip 🃏
Exención de responsabilidad
La información y las publicaciones no constituyen, ni deben considerarse como, asesoramiento o recomendaciones financieras, de inversión, de trading u otro tipo, proporcionadas o respaldadas por TradingView. Obtenga más información en Condiciones de uso.
Script de código abierto
Fiel al espíritu de TradingView, el creador de este script lo ha convertido en código abierto, para que los traders puedan revisar y verificar su funcionalidad. ¡Enhorabuena al autor! Aunque puede utilizarlo de forma gratuita, recuerde que cualquier republicación del código está sujeta a nuestras Normas internas.
The Institutional Grade Trading Ecosystem, Built to win trades 📈
Get Access 👇
jackofalltrades.vip 🌐
t.me/jackofalltradesvip 🃏
Get Access 👇
jackofalltrades.vip 🌐
t.me/jackofalltradesvip 🃏
Exención de responsabilidad
La información y las publicaciones no constituyen, ni deben considerarse como, asesoramiento o recomendaciones financieras, de inversión, de trading u otro tipo, proporcionadas o respaldadas por TradingView. Obtenga más información en Condiciones de uso.