OPEN-SOURCE SCRIPT
Actualizado Nifty Reversal Levels
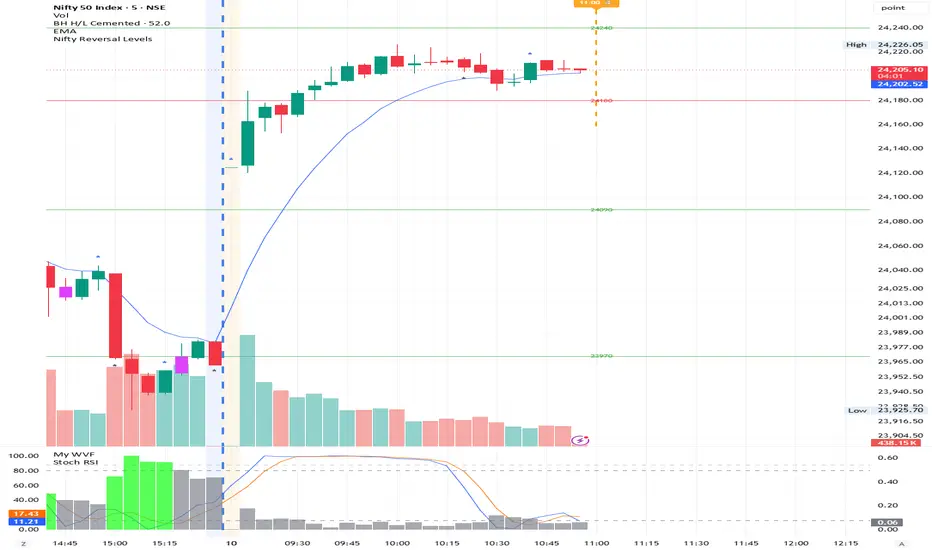
To mark expected reversal levels based on date and time on a Nifty chart
How to set up Alerts on 5-min TF
Switch chart to 5 min
Add indicator → Pine Editor → Paste → Save → Add to chart
Click Alerts (bell icon) → Create Alert
Condition: Nifty Reversal Levels → choose one of the 3 alert conditions
Set "Once Per Bar Close" for the price cross alert
How to set up Alerts on 5-min TF
Switch chart to 5 min
Add indicator → Pine Editor → Paste → Save → Add to chart
Click Alerts (bell icon) → Create Alert
Condition: Nifty Reversal Levels → choose one of the 3 alert conditions
Set "Once Per Bar Close" for the price cross alert
Notas de prensa
━━━━━━━━━━━━━━━━━━━━━━━━━━━━━━━━━━━━━━━━━━━━━━━━━━━━━━━━NIFTY REVERSAL LEVELS + TIME ALERTS
━━━━━━━━━━━━━━━━━━━━━━━━━━━━━━━━━━━━━━━━━━━━━━━━━━━━━━━━
This indicator plots key price reversal levels and intraday
reversal times on the Nifty chart. It automatically evaluates
whether each level was respected (price reversed) or broken
(price continued), and colours the line accordingly.
Best used on the 5-minute timeframe.
─────────────────────────────────────────────────────────
WHAT IT DOES
─────────────────────────────────────────────────────────
PRICE LEVELS
• Draws horizontal lines at each supplied price level
• Monitors each level for a touch (bar high/low crosses it)
• Waits N candles after the touch and delivers a verdict:
→ Green — price reversed back (level was respected)
→ Red — price continued through (level was broken)
→ Yellow — level not yet touched, or verdict still pending
TIME LEVELS
• Draws a vertical dashed line at each reversal time on the
specified date
• Checks the candle direction at that time bar and evaluates
the next N candles:
→ Green — price reversed after the time bar
→ Red — price continued in the same direction
→ Orange — default / pending
INFO TABLE (top-right corner)
• Lists all price levels with distance % from current price
• Lists all time levels with status (Upcoming / Done / NOW)
• Arrows show whether each level is above or below price
─────────────────────────────────────────────────────────
INPUTS
─────────────────────────────────────────────────────────
PRICE LEVELS
Input : Paste levels separated by /
Example: 24476/24356/24266/24206/24146/24086/
24059/23996/23876/23696/23670/23551
Note : Spaces and line breaks are ignored — paste
directly from your levels sheet.
DATE (DD/MM/YYYY)
Input : The date for which time levels apply
Example: 12/05/2026
Note : Vertical time lines are drawn ONLY on this date.
REVERSAL TIMES (HH:MM, IST)
Input : Comma-separated times in 24-hour format
Example: 10:30,12:45,14:55
REVERSAL CHECK CANDLES
Default : 3
Range : 1 – 20
Meaning : How many candles after a touch/time bar to wait
before deciding Respected (green) or Broken (red).
Lower = faster verdict, higher = more confirmation.
COLOURS
Default Level Color — Yellow (untouched / pending)
Respected/Reversal — Green (level held)
Broken Level Color — Red (level broken)
Time Level Color — Orange (vertical lines)
LINE WIDTH
Range: 1 – 5
─────────────────────────────────────────────────────────
ALERTS (set up from the Alerts panel)
─────────────────────────────────────────────────────────
Three alert conditions are built in. Go to:
Alerts (bell icon) → Create Alert → Condition →
select "Nifty Reversal Levels", then pick one below.
1. Price Level Hit
Fires when the current bar's high/low touches any
price level. Message includes price and time.
2. Reversal Time
Fires when the chart bar matches a reversal time on
the target date. Message includes time and price.
3. Any Alert (Price OR Time)
Fires on either of the above — useful if you want a
single notification for all triggers.
Recommended setting: "Once Per Bar" to avoid repeat alerts
on the same candle.
─────────────────────────────────────────────────────────
HOW TO USE
─────────────────────────────────────────────────────────
DAILY SETUP (2 minutes each morning)
Step 1 — Open Settings → Price Levels
Paste today's slash-separated levels.
Step 2 — Open Settings → Date
Set today's date in DD/MM/YYYY format.
Step 3 — Open Settings → Reversal Times
Enter today's reversal times, e.g. 10:30,12:45,14:55
Step 4 — Switch chart to 5-minute timeframe.
Step 5 — Set up your alerts (see Alerts section above).
READING THE CHART
Yellow line → Level not yet tested today. Watch for a
touch and be ready to trade the reaction.
Green line → Level has been tested and held. Price
reversed away within the check window.
Treat as active support/resistance.
Red line → Level was broken. Price pushed through
and did not reverse. May now act as
support-turns-resistance or vice versa.
Orange vertical line → A reversal time has been reached.
Watch for a change in momentum.
Green = reversal happened.
Red = trend continued.
TIPS
• Increase "Reversal Check Candles" to 5 on choppy days
for fewer false verdicts.
• A green level that price returns to later is a high-
probability trade setup.
• When a time level and a price level coincide, the
confluence is significant — size accordingly.
─────────────────────────────────────────────────────────
INPUT FORMAT REFERENCE
─────────────────────────────────────────────────────────
Full example of what to paste each morning:
Price Levels field:
24476/24356/24266/24206/24146/24086/
24059/23996/23876/23696/23670/23551
Date field:
12/05/2026
Reversal Times field:
10:30,12:45,14:55
Reversal Check Candles:
3
━━━━━━━━━━━━━━━━━━━━━━━━━━━━━━━━━━━━━━━━━━━━━━━━━━━━━━━━
Notas de prensa
Bug FixNotas de prensa
Added tableNotas de prensa
Bug fixNotas de prensa
Now Vertical lines for time will be drawn on advanceNotas de prensa
Updated screenshotNotas de prensa
Overdrawing of time levels updatedScript de código abierto
Fiel al espíritu de TradingView, el creador de este script lo ha convertido en código abierto, para que los traders puedan revisar y verificar su funcionalidad. ¡Enhorabuena al autor! Aunque puede utilizarlo de forma gratuita, recuerde que cualquier republicación del código está sujeta a nuestras Normas internas.

Exención de responsabilidad
La información y las publicaciones no constituyen, ni deben considerarse como, asesoramiento o recomendaciones financieras, de inversión, de trading u otro tipo, proporcionadas o respaldadas por TradingView. Obtenga más información en Condiciones de uso.
Script de código abierto
Fiel al espíritu de TradingView, el creador de este script lo ha convertido en código abierto, para que los traders puedan revisar y verificar su funcionalidad. ¡Enhorabuena al autor! Aunque puede utilizarlo de forma gratuita, recuerde que cualquier republicación del código está sujeta a nuestras Normas internas.
Exención de responsabilidad
La información y las publicaciones no constituyen, ni deben considerarse como, asesoramiento o recomendaciones financieras, de inversión, de trading u otro tipo, proporcionadas o respaldadas por TradingView. Obtenga más información en Condiciones de uso.