JZ Breakout Volume
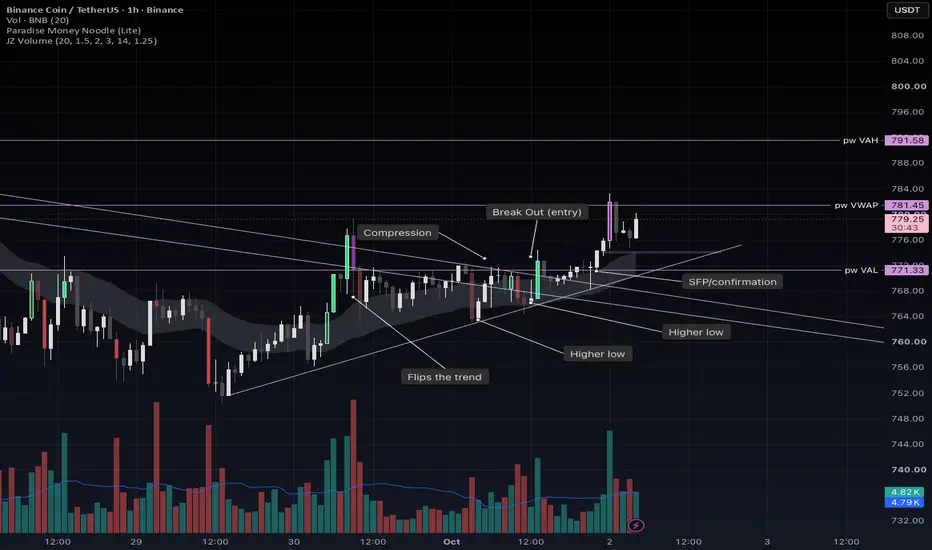
# JZ Breakout Volume
**JZ Breakout Volume** is a price-overlay indicator designed to make abnormal volume immediately visible on the chart.
The indicator was built primarily as a **confirmation tool for breakouts and breakdowns**. Rather than relying on visually comparing standard volume bars, it colours price candles when volume is significantly elevated relative to recent trading activity.
## How It Works
The indicator calculates **Relative Volume (RVOL)** by comparing the current candle's volume with the average volume of the previous 20 completed candles:
**RVOL = Current Volume ÷ Average Volume of Previous 20 Candles**
Using relative rather than absolute volume allows the indicator to adapt across different assets and timeframes.
By default:
- **1.5× RVOL** — Elevated participation
- **2.0× RVOL** — Strong participation
- **3.0× RVOL** — Extreme / potentially climactic participation
The indicator also measures **price expansion relative to ATR**.
A candle that produces both **2×+ relative volume and a range of at least 1.25× ATR** receives the strongest bullish or bearish highlighting. This helps distinguish high-volume candles that actually produce meaningful price expansion from candles where substantial volume generates little price movement.
## Candle Colours
Faded green/red indicates elevated volume.
Strong green/red indicates high relative volume.
Bright green/red identifies the primary signal: **strong relative volume combined with meaningful price expansion**.
Purple identifies **extreme relative volume (3×+)**. Extreme volume is intentionally treated separately because exceptionally high volume can represent continuation, climax, absorption, or exhaustion depending on market structure.
## Intended Use
This is **not a standalone entry signal**.
It is designed to provide additional confirmation when price is already presenting a technically valid setup, particularly:
**Consolidation → Higher Low / Lower High → Level or Trendline Break → Volume Expansion**
The objective is simple: make it immediately obvious when genuine market participation arrives during a breakout.
All major thresholds, including volume lookback, RVOL levels, ATR length, and price-expansion requirements, can be customized in the indicator settings.
**JZ Breakout Volume** is a price-overlay indicator designed to make abnormal volume immediately visible on the chart.
The indicator was built primarily as a **confirmation tool for breakouts and breakdowns**. Rather than relying on visually comparing standard volume bars, it colours price candles when volume is significantly elevated relative to recent trading activity.
## How It Works
The indicator calculates **Relative Volume (RVOL)** by comparing the current candle's volume with the average volume of the previous 20 completed candles:
**RVOL = Current Volume ÷ Average Volume of Previous 20 Candles**
Using relative rather than absolute volume allows the indicator to adapt across different assets and timeframes.
By default:
- **1.5× RVOL** — Elevated participation
- **2.0× RVOL** — Strong participation
- **3.0× RVOL** — Extreme / potentially climactic participation
The indicator also measures **price expansion relative to ATR**.
A candle that produces both **2×+ relative volume and a range of at least 1.25× ATR** receives the strongest bullish or bearish highlighting. This helps distinguish high-volume candles that actually produce meaningful price expansion from candles where substantial volume generates little price movement.
## Candle Colours
Faded green/red indicates elevated volume.
Strong green/red indicates high relative volume.
Bright green/red identifies the primary signal: **strong relative volume combined with meaningful price expansion**.
Purple identifies **extreme relative volume (3×+)**. Extreme volume is intentionally treated separately because exceptionally high volume can represent continuation, climax, absorption, or exhaustion depending on market structure.
## Intended Use
This is **not a standalone entry signal**.
It is designed to provide additional confirmation when price is already presenting a technically valid setup, particularly:
**Consolidation → Higher Low / Lower High → Level or Trendline Break → Volume Expansion**
The objective is simple: make it immediately obvious when genuine market participation arrives during a breakout.
All major thresholds, including volume lookback, RVOL levels, ATR length, and price-expansion requirements, can be customized in the indicator settings.

Exención de responsabilidad
La información y las publicaciones no constituyen, ni deben considerarse como, asesoramiento o recomendaciones financieras, de inversión, de trading u otro tipo, proporcionadas o respaldadas por TradingView. Obtenga más información en Condiciones de uso.
Exención de responsabilidad
La información y las publicaciones no constituyen, ni deben considerarse como, asesoramiento o recomendaciones financieras, de inversión, de trading u otro tipo, proporcionadas o respaldadas por TradingView. Obtenga más información en Condiciones de uso.