OPEN-SOURCE SCRIPT
SS Keltner Line
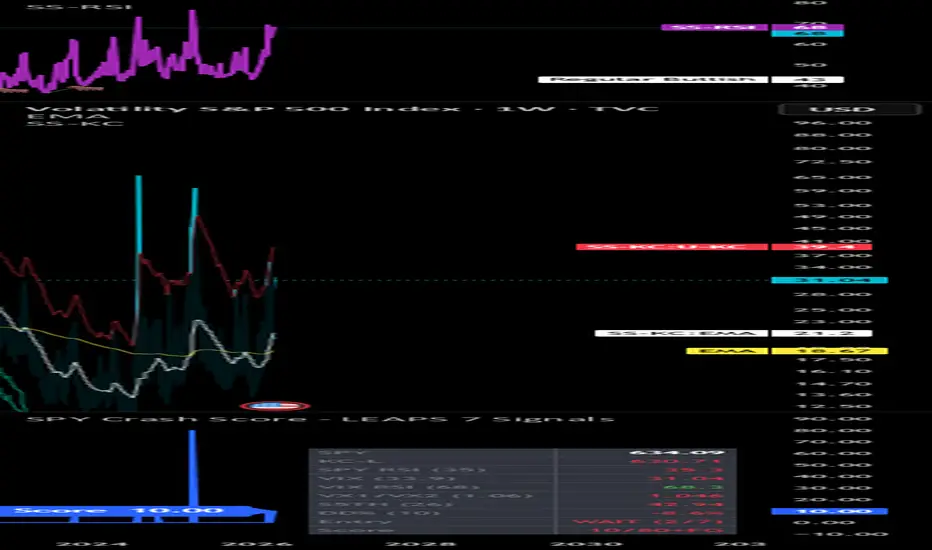
A customised Keltner Channel indicator designed for crash detection and mean-reversion entries on SPY and broad market indices. Unlike standard Keltner Channel implementations, this version uses an asymmetric band structure — a wider upper band for overbought detection and two tiered lower bands to distinguish between moderate and deep oversold conditions.
Band structure:
Upper band — EMA + 2.75 × ATR(10) — blue. Overbought / extended zone
Basis — 20-period EMA — yellow. Mean reversion target / take profit level
Lower band 2.0 — EMA − 2.0 × ATR(10) — green. First oversold zone, initial entry consideration
Lower band 2.5 — EMA − 2.5 × ATR(10) — red. Deep oversold zone, high-conviction entry
Visual fill zones:
Light blue fill between upper band and EMA — extended/overbought territory
Light green fill between EMA and lower 2.0 — mild pullback zone
Light red fill between lower 2.0 and lower 2.5 — deep crash zone, primary LEAPS entry region
Intended use:
On the weekly chart, a SPY close at or below the green lower band (2.0×) forms part of a multi-signal crash entry system. A close into the red zone (2.5×) represents an extreme reading historically associated with maximum fear entries. The EMA basis serves as the primary take-profit target on mean reversion.
Part of the SS LEAPS crash trading system. Best used on weekly timeframe alongside VIX RSI, Fear & Greed, S5TH breadth, and VX1!/VX2! backwardation signals.
Band structure:
Upper band — EMA + 2.75 × ATR(10) — blue. Overbought / extended zone
Basis — 20-period EMA — yellow. Mean reversion target / take profit level
Lower band 2.0 — EMA − 2.0 × ATR(10) — green. First oversold zone, initial entry consideration
Lower band 2.5 — EMA − 2.5 × ATR(10) — red. Deep oversold zone, high-conviction entry
Visual fill zones:
Light blue fill between upper band and EMA — extended/overbought territory
Light green fill between EMA and lower 2.0 — mild pullback zone
Light red fill between lower 2.0 and lower 2.5 — deep crash zone, primary LEAPS entry region
Intended use:
On the weekly chart, a SPY close at or below the green lower band (2.0×) forms part of a multi-signal crash entry system. A close into the red zone (2.5×) represents an extreme reading historically associated with maximum fear entries. The EMA basis serves as the primary take-profit target on mean reversion.
Part of the SS LEAPS crash trading system. Best used on weekly timeframe alongside VIX RSI, Fear & Greed, S5TH breadth, and VX1!/VX2! backwardation signals.
Script de código abierto
Fiel al espíritu de TradingView, el creador de este script lo ha convertido en código abierto, para que los traders puedan revisar y verificar su funcionalidad. ¡Enhorabuena al autor! Aunque puede utilizarlo de forma gratuita, recuerde que cualquier republicación del código está sujeta a nuestras Normas internas.

Exención de responsabilidad
La información y las publicaciones no constituyen, ni deben considerarse como, asesoramiento o recomendaciones financieras, de inversión, de trading u otro tipo, proporcionadas o respaldadas por TradingView. Obtenga más información en Condiciones de uso.
Script de código abierto
Fiel al espíritu de TradingView, el creador de este script lo ha convertido en código abierto, para que los traders puedan revisar y verificar su funcionalidad. ¡Enhorabuena al autor! Aunque puede utilizarlo de forma gratuita, recuerde que cualquier republicación del código está sujeta a nuestras Normas internas.
Exención de responsabilidad
La información y las publicaciones no constituyen, ni deben considerarse como, asesoramiento o recomendaciones financieras, de inversión, de trading u otro tipo, proporcionadas o respaldadas por TradingView. Obtenga más información en Condiciones de uso.