Actualizado
Sogyo RTH / RTH2 Gap Midpoint Zone (CE1 / CE2)
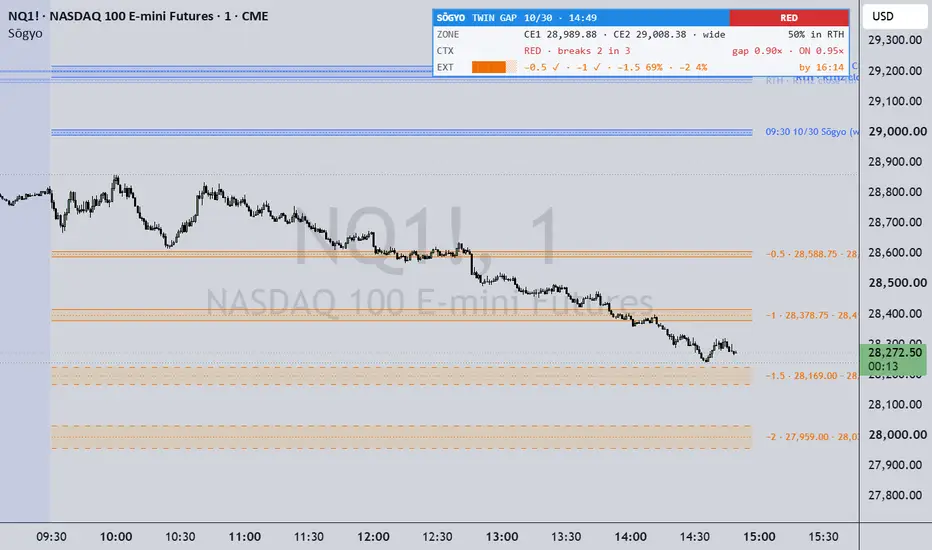
Sogyo (Sogyo no Kotowari, the twin fish) marks two midpoints of the opening gap and draws them as one zone. Price respects that zone more often than you’d expect: sometimes as a level it trades back to, sometimes as a wall it can’t get back through.
Most people use one close to measure the gap. Futures have two:
the RTH close at 16:14 ET
the RTH2 close at 16:59 ET, the settlement close
Sōgyo takes the 50% level of each gap and draws the zone between them:
CE1 = (prior 16:14 close + today’s 09:30 open) / 2
CE2 = (prior 16:59 close + today’s 09:30 open) / 2
When the settlement window (16:14 to 16:59) moves a lot, the two midpoints separate and the zone gets wide. Those are the days to pay attention to. The script flags them as “wide”.
WHAT YOU SEE ON THE CHART
The zone between CE1 and CE2, drawn from 09:30 ET, with its formation time and date to the right
Dashed and dotted lines at the prior RTH and RTH2 closes, which are the full gap-fill levels
Zones coloured by age: blue for the first 5 trading days, then grey, so fresh levels stand out from old ones
A table showing: RTH ATR, the gap and overnight range in points and in ATR, both CE levels, the zone width, and the day’s context
HOW I USE IT (NY AM, 09:30–12:00 ET)
At the open, read the context in the table:
GREEN: small gap (≤ 0.68 ATR) and a quiet overnight (≤ 0.45 ATR). The zone is valid confluence.
NEUTRAL: don’t put extra weight on the zone.
RED: big gap (> 0.68 ATR). Price usually treats the zone as a stop on the way to the full fill, not a wall.
SPLIT: the open sits between the two closes. Skip it.
The setup I watch most is the flipped wall. On a wide-zone day price breaks through the zone toward the fill, comes back, and the zone holds it off.
Use it as confluence alongside your own entries. It isn’t a signal on its own.
What the backtest says (my own testing, NQ 2018 & 2022–2026, ES 2023–2026):
The zone gets touched during NY AM on about 65% of days.
Flipped wall: after price breaks through and comes back, the zone holds about 53% of the time. On wide-zone days that’s about 55–57%. Zones of the same width placed at random gap levels hold about 49%.
That’s a small edge, not a magic line. Manage risk on every trade.
SETTINGS
Sessions (ET):
RTH (default 09:30–16:15): the close comes from the 16:14 bar
RTH2 (default 09:30–17:00): the close comes from the 16:59 bar
Overnight (default 18:00–09:30): used for the overnight-range filter
ATR & context:
RTH sessions to average (14): ATR here is a simple average of the RTH high-to-low ranges only, not the standard ATR
Red: gap > x ATR (0.68)
Green: overnight range ≤ x ATR (0.45)
Wide zone: width ≥ x % of price (0.05%)
Drawing:
Zone length: To last candle, or Until next zone
Zones to keep (10)
Label date format (HH:mm MM/dd)
Show CE1 / CE2 prices in the label
Show prior closes (full gap fill)
Text colour and text size
Colour:
Colour zones: By age or By context
Fresh for first N trading days (5)
Fresh colour, aged colour, grey out aged text
Table: on/off and position.
Works on intraday charts (1–15 min). Built and tested on NQ and ES; all times are New York time.
OPEN SOURCE
This is free and open source. Take it apart, improve it, test it on your own markets, and build on it. If you find something, share it back.
A NOTE FROM ME
I built this while working nights and studying, testing idea after idea that didn’t work until one did. Most of what I tested failed. I kept going anyway, because every failed test told me something.
If you’re in that place right now, where the backtests don’t work and the account isn’t where you want it, don’t give up. Believe in yourself more than the setbacks do. Test properly, be honest with your numbers, and keep showing up. You’ll get there.
- Unclehk2000
Not financial advice. Educational tool only. Past results don’t guarantee future results.
Most people use one close to measure the gap. Futures have two:
the RTH close at 16:14 ET
the RTH2 close at 16:59 ET, the settlement close
Sōgyo takes the 50% level of each gap and draws the zone between them:
CE1 = (prior 16:14 close + today’s 09:30 open) / 2
CE2 = (prior 16:59 close + today’s 09:30 open) / 2
When the settlement window (16:14 to 16:59) moves a lot, the two midpoints separate and the zone gets wide. Those are the days to pay attention to. The script flags them as “wide”.
WHAT YOU SEE ON THE CHART
The zone between CE1 and CE2, drawn from 09:30 ET, with its formation time and date to the right
Dashed and dotted lines at the prior RTH and RTH2 closes, which are the full gap-fill levels
Zones coloured by age: blue for the first 5 trading days, then grey, so fresh levels stand out from old ones
A table showing: RTH ATR, the gap and overnight range in points and in ATR, both CE levels, the zone width, and the day’s context
HOW I USE IT (NY AM, 09:30–12:00 ET)
At the open, read the context in the table:
GREEN: small gap (≤ 0.68 ATR) and a quiet overnight (≤ 0.45 ATR). The zone is valid confluence.
NEUTRAL: don’t put extra weight on the zone.
RED: big gap (> 0.68 ATR). Price usually treats the zone as a stop on the way to the full fill, not a wall.
SPLIT: the open sits between the two closes. Skip it.
The setup I watch most is the flipped wall. On a wide-zone day price breaks through the zone toward the fill, comes back, and the zone holds it off.
Use it as confluence alongside your own entries. It isn’t a signal on its own.
What the backtest says (my own testing, NQ 2018 & 2022–2026, ES 2023–2026):
The zone gets touched during NY AM on about 65% of days.
Flipped wall: after price breaks through and comes back, the zone holds about 53% of the time. On wide-zone days that’s about 55–57%. Zones of the same width placed at random gap levels hold about 49%.
That’s a small edge, not a magic line. Manage risk on every trade.
SETTINGS
Sessions (ET):
RTH (default 09:30–16:15): the close comes from the 16:14 bar
RTH2 (default 09:30–17:00): the close comes from the 16:59 bar
Overnight (default 18:00–09:30): used for the overnight-range filter
ATR & context:
RTH sessions to average (14): ATR here is a simple average of the RTH high-to-low ranges only, not the standard ATR
Red: gap > x ATR (0.68)
Green: overnight range ≤ x ATR (0.45)
Wide zone: width ≥ x % of price (0.05%)
Drawing:
Zone length: To last candle, or Until next zone
Zones to keep (10)
Label date format (HH:mm MM/dd)
Show CE1 / CE2 prices in the label
Show prior closes (full gap fill)
Text colour and text size
Colour:
Colour zones: By age or By context
Fresh for first N trading days (5)
Fresh colour, aged colour, grey out aged text
Table: on/off and position.
Works on intraday charts (1–15 min). Built and tested on NQ and ES; all times are New York time.
OPEN SOURCE
This is free and open source. Take it apart, improve it, test it on your own markets, and build on it. If you find something, share it back.
A NOTE FROM ME
I built this while working nights and studying, testing idea after idea that didn’t work until one did. Most of what I tested failed. I kept going anyway, because every failed test told me something.
If you’re in that place right now, where the backtests don’t work and the account isn’t where you want it, don’t give up. Believe in yourself more than the setbacks do. Test properly, be honest with your numbers, and keep showing up. You’ll get there.
- Unclehk2000
Not financial advice. Educational tool only. Past results don’t guarantee future results.
Notas de prensa
• New card in the house style: an accent stripe, a header pill with today's grade (GREEN, RED, SPLIT, NEUTRAL) and a tinted body. Rows: CE1, CE2, zone width, gap and overnight range in ATR, and the ATR with the red threshold. Every cell has a tooltip.• Settings:
– a View section at the top: Theme, Layout (Desktop / Mobile, a four-row card for a phone), Card text, Label text, Label colour and the date format;
– the card can sit in any of eight places and has its own accent colour.
• Fix: the RTH ATR is now read from 15-minute bars. Before, it needed 14 full sessions of chart history, so on a 1-minute chart (and in Bar Replay) it often showed "— (loading ATR)" and the zone was never graded. The levels and the rules are unchanged.
• Theme: Auto follows the chart, so the text reads on dark charts as well as light; a colour you pick still overrides it.
• The settings values no longer fill the status line next to the indicator's name.
Notas de prensa
• Any timeframe. Above 15 minutes (1 hour, 4 hours, daily) Sōgyo reads 15-minute bars, so the 16:14 close, the 16:59 close and the 09:30 open match a 1-minute chart, and touches are timed to the 15-minute bar. At 15 minutes and below it reads the chart's own bars, as before.• Tubes, drawn the way OpenGaps draws NWOG / NDOG: the zone, the prior closes and each band are tubes (two lines, shaded between, a dotted centre) carried past the last candle, labelled at the mouth (reached, filled, ✓ and the time, or the odds). Older zones fade, further once reached or filled. Five zones kept by default.
• The RTH gap graded as a fib (1 = the prior close, 0 = the 09:30 open), once from the 16:14 close and once from the 16:59 close. The same level from both is a twin band: −0.5, −1, −1.5 (on), −2, and 1.5 / 2 past the closes (off). Each can be switched on or off, as can all of them, the odds, and earlier days' bands.
• Each band carries the live odds of trading by 16:14, from its distance in RTH ATR and the time left; ✓ and the time once it trades; "not reached" after 16:14. Scored on 2025–26 after fitting on 2018–24: Brier 0.117 (size-and-time table) → 0.091.
• How often they trade by 16:14 (NQ + ES + RTY 2018–26, 5,932 days): −0.5 78%, −1 61%, −1.5 49%, −2 40%; for gaps under half their 20-session average, −1 87%; over 2.5×, 21%.
• Tested and not found: a band turning price at the first touch (real paths turned 1–3 points less often than shuffled bars, and ICT's levels no more often than quarter steps), and runs ending at a band. Targets, not walls.
• The card is now a tally: ZONE (CE1 · CE2, ✓ or today's rate), CTX (the context read, gap and overnight in ATR), EXT (the run beyond the open and each band's ✓ or odds). Mobile: the ZONE and EXT results.
• Labels at nearly the same price share one, in the colour of the most current. Unchanged: the zone, the prior closes, the context rules, the 15-minute RTH ATR.

Exención de responsabilidad
La información y las publicaciones no constituyen, ni deben considerarse como, asesoramiento o recomendaciones financieras, de inversión, de trading u otro tipo, proporcionadas o respaldadas por TradingView. Obtenga más información en Condiciones de uso.
Exención de responsabilidad
La información y las publicaciones no constituyen, ni deben considerarse como, asesoramiento o recomendaciones financieras, de inversión, de trading u otro tipo, proporcionadas o respaldadas por TradingView. Obtenga más información en Condiciones de uso.