Satish Goyani 10Min Gap/Move Strategy
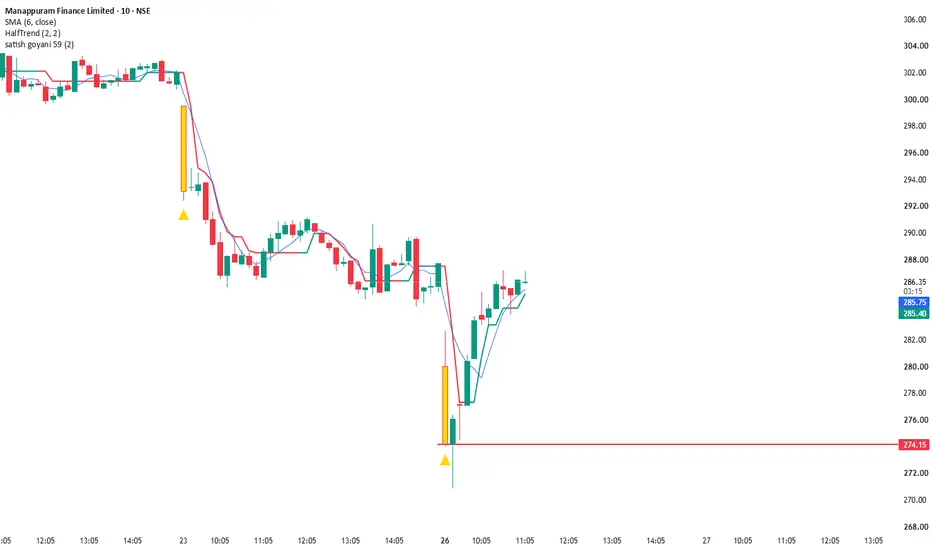
This indicator identifies high-momentum opening moves on the 10-minute timeframe based on the previous day's close.
### How it Works:
1. **Timeframe:** Optimized specifically for the **10-minute (10m)** chart.
2. **Condition:** It calculates the percentage difference between the **Previous Day's Close** and the **First 10-minute candle's close** of the current day.
3. **Target:** If the absolute price movement meets or exceeds the user-defined percentage (Default: **2.0%**), it triggers a signal.
4. **Visuals:**
- Highlights the qualifying first 10-minute candle in **Gold** color.
- Plots a **Gold Arrow** below the candle for quick visual identification.
### Inputs:
* **Target Percentage (%)**: Adjustable threshold for the minimum price move required (Default is 2.0%).
*Note: This script is intended for educational and analytical purposes on 10-minute intraday charts.*
### How it Works:
1. **Timeframe:** Optimized specifically for the **10-minute (10m)** chart.
2. **Condition:** It calculates the percentage difference between the **Previous Day's Close** and the **First 10-minute candle's close** of the current day.
3. **Target:** If the absolute price movement meets or exceeds the user-defined percentage (Default: **2.0%**), it triggers a signal.
4. **Visuals:**
- Highlights the qualifying first 10-minute candle in **Gold** color.
- Plots a **Gold Arrow** below the candle for quick visual identification.
### Inputs:
* **Target Percentage (%)**: Adjustable threshold for the minimum price move required (Default is 2.0%).
*Note: This script is intended for educational and analytical purposes on 10-minute intraday charts.*

Exención de responsabilidad
La información y las publicaciones no constituyen, ni deben considerarse como, asesoramiento o recomendaciones financieras, de inversión, de trading u otro tipo, proporcionadas o respaldadas por TradingView. Obtenga más información en Condiciones de uso.
Exención de responsabilidad
La información y las publicaciones no constituyen, ni deben considerarse como, asesoramiento o recomendaciones financieras, de inversión, de trading u otro tipo, proporcionadas o respaldadas por TradingView. Obtenga más información en Condiciones de uso.