Compare Overlay (Bottom of Screen)
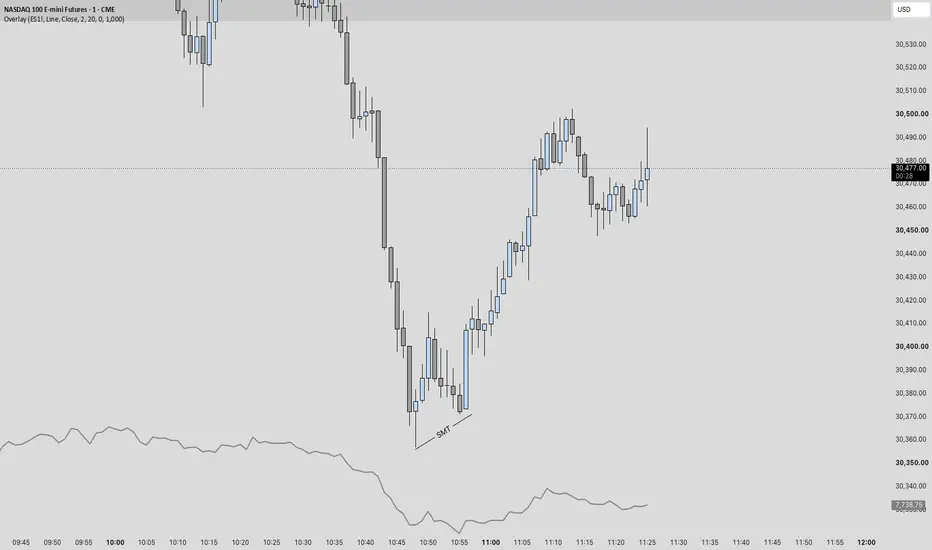
Plots a second symbol (ES1! by default) directly on your main chart, pinned to the bottom of the screen instead of in a separate pane. It works like TradingView's "Compare symbol" tool, but it runs on its own hidden scale, so it isn't tied to your main chart's price. You can drag, zoom or rescale the chart and the overlay stays in a band along the bottom edge.
Built for spotting SMT divergence between NQ and ES without giving up screen space to an extra pane.
HOW IT WORKS
The script plots the comparison symbol on a hidden "No scale" axis. It measures the symbol's high and low across the bars currently on screen, then places invisible anchors so the symbol fills a set band at the bottom of the chart. It recalculates whenever you scroll or zoom. Backup anchors on off-screen bars keep it near the bottom while the chart catches up during a zoom.
STYLES
- Line: a single line using your chosen price source (Open, High, Low, Close, HL2, HLC3, OHLC4)
- Candles / Hollow candles: full candles with wicks
- Bars: OHLC bars
- High/Low lines: two lines tracing every high and low. The cleanest option for SMT.
SETTINGS
- Symbol: any symbol you want to compare (ES, YM, RTY, DXY, etc.)
- Style, colours, line width, price label and price line
- Band height: how much of the screen the overlay uses
- Bottom padding: space between the overlay and the bottom edge
- Zoom stability: how many bars the backup anchors look at. Raise it if the overlay drifts up when you zoom out a long way.
TIPS
- For SMT, use High/Low lines or Bars so every wick is visible. Bearish SMT shows on the highs, bullish SMT on the lows.
- To have the overlay sit right on the bottom edge, set Bottom padding to 0 and set Chart settings > Canvas > Margins > Bottom to 0.
- If the overlay ever follows your main chart's price, right-click it and choose Pin to scale > No scale (full screen).
NOTES
- The overlay shows the shape of the second symbol's price action scaled to fit the band. It is not price-aligned with the main chart.
- It may shift briefly while you are actively zooming, then snap back once the chart finishes recalculating.
Built for spotting SMT divergence between NQ and ES without giving up screen space to an extra pane.
HOW IT WORKS
The script plots the comparison symbol on a hidden "No scale" axis. It measures the symbol's high and low across the bars currently on screen, then places invisible anchors so the symbol fills a set band at the bottom of the chart. It recalculates whenever you scroll or zoom. Backup anchors on off-screen bars keep it near the bottom while the chart catches up during a zoom.
STYLES
- Line: a single line using your chosen price source (Open, High, Low, Close, HL2, HLC3, OHLC4)
- Candles / Hollow candles: full candles with wicks
- Bars: OHLC bars
- High/Low lines: two lines tracing every high and low. The cleanest option for SMT.
SETTINGS
- Symbol: any symbol you want to compare (ES, YM, RTY, DXY, etc.)
- Style, colours, line width, price label and price line
- Band height: how much of the screen the overlay uses
- Bottom padding: space between the overlay and the bottom edge
- Zoom stability: how many bars the backup anchors look at. Raise it if the overlay drifts up when you zoom out a long way.
TIPS
- For SMT, use High/Low lines or Bars so every wick is visible. Bearish SMT shows on the highs, bullish SMT on the lows.
- To have the overlay sit right on the bottom edge, set Bottom padding to 0 and set Chart settings > Canvas > Margins > Bottom to 0.
- If the overlay ever follows your main chart's price, right-click it and choose Pin to scale > No scale (full screen).
NOTES
- The overlay shows the shape of the second symbol's price action scaled to fit the band. It is not price-aligned with the main chart.
- It may shift briefly while you are actively zooming, then snap back once the chart finishes recalculating.

Exención de responsabilidad
La información y las publicaciones no constituyen, ni deben considerarse como, asesoramiento o recomendaciones financieras, de inversión, de trading u otro tipo, proporcionadas o respaldadas por TradingView. Obtenga más información en Condiciones de uso.
Exención de responsabilidad
La información y las publicaciones no constituyen, ni deben considerarse como, asesoramiento o recomendaciones financieras, de inversión, de trading u otro tipo, proporcionadas o respaldadas por TradingView. Obtenga más información en Condiciones de uso.