OPEN-SOURCE SCRIPT
Weekly 30 SMA + 30 EMA Ribbon + Spread SD
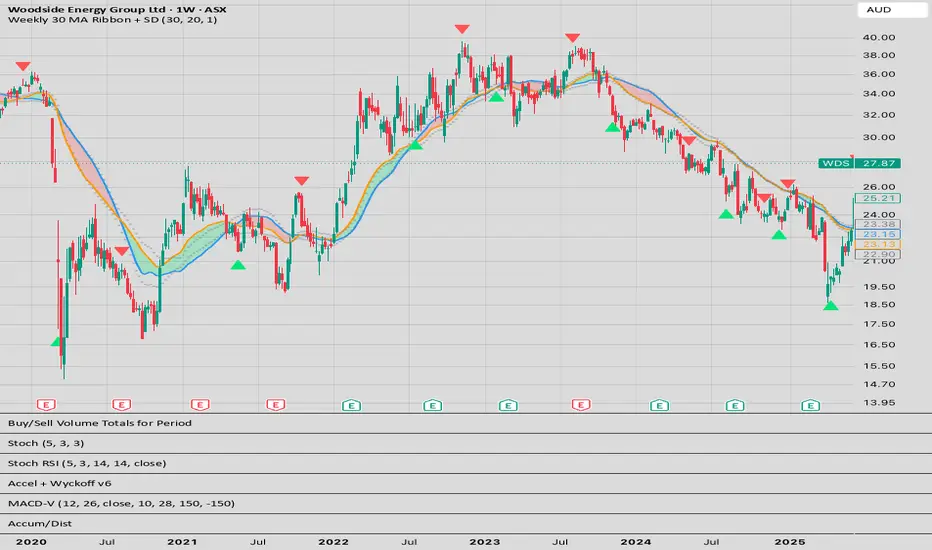
Description
Classic 30-week moving average ribbon (Stan Weinstein / Stage Analysis style) with added Spread + Standard Deviation bands for volatility awareness.
Key Features
True Weekly 30 SMA & 30 EMA (your 30-week MA)
Colored ribbon between the two MAs (Red when SMA > EMA, Green when EMA > SMA)
Spread ± Standard Deviation bands (default 20-period)
Visual cross markers
Works best on Daily or Weekly charts
How to Use
Best viewed on Daily or Weekly charts.
Green ribbon = EMA above SMA (bullish trend support in Stage 2 - RED FLAG indicators crossover).
Red ribbon = SMA above EMA (bearish or distribution - GREEN FLAG indicators crossover) - [I forgot to change the flag colours to match, you can do this adjustment yourself.]
Monitor how far the ribbon stretches relative to the SD bands — wide spreads often precede mean reversion or acceleration.
Adjust SD Length for more/less sensitivity (20 is balanced).
Pros
Directly implements the popular 30-week MA concept
SD bands add objective volatility context to traditional stage analysis
Excellent for identifying accumulation/distribution phases and trend strength
Clean and not over-cluttered
Cons / Limitations
Weekly data updates more slowly (less useful for very short-term trading)
Color scheme is intentionally swapped — users may need a short adjustment period
Like all MA tools, it lags price and works best in trending markets
Classic 30-week moving average ribbon (Stan Weinstein / Stage Analysis style) with added Spread + Standard Deviation bands for volatility awareness.
Key Features
True Weekly 30 SMA & 30 EMA (your 30-week MA)
Colored ribbon between the two MAs (Red when SMA > EMA, Green when EMA > SMA)
Spread ± Standard Deviation bands (default 20-period)
Visual cross markers
Works best on Daily or Weekly charts
How to Use
Best viewed on Daily or Weekly charts.
Green ribbon = EMA above SMA (bullish trend support in Stage 2 - RED FLAG indicators crossover).
Red ribbon = SMA above EMA (bearish or distribution - GREEN FLAG indicators crossover) - [I forgot to change the flag colours to match, you can do this adjustment yourself.]
Monitor how far the ribbon stretches relative to the SD bands — wide spreads often precede mean reversion or acceleration.
Adjust SD Length for more/less sensitivity (20 is balanced).
Pros
Directly implements the popular 30-week MA concept
SD bands add objective volatility context to traditional stage analysis
Excellent for identifying accumulation/distribution phases and trend strength
Clean and not over-cluttered
Cons / Limitations
Weekly data updates more slowly (less useful for very short-term trading)
Color scheme is intentionally swapped — users may need a short adjustment period
Like all MA tools, it lags price and works best in trending markets
Script de código abierto
Fiel al espíritu de TradingView, el creador de este script lo ha convertido en código abierto, para que los traders puedan revisar y verificar su funcionalidad. ¡Enhorabuena al autor! Aunque puede utilizarlo de forma gratuita, recuerde que cualquier republicación del código está sujeta a nuestras Normas internas.

Exención de responsabilidad
La información y las publicaciones no constituyen, ni deben considerarse como, asesoramiento o recomendaciones financieras, de inversión, de trading u otro tipo, proporcionadas o respaldadas por TradingView. Obtenga más información en Condiciones de uso.
Script de código abierto
Fiel al espíritu de TradingView, el creador de este script lo ha convertido en código abierto, para que los traders puedan revisar y verificar su funcionalidad. ¡Enhorabuena al autor! Aunque puede utilizarlo de forma gratuita, recuerde que cualquier republicación del código está sujeta a nuestras Normas internas.
Exención de responsabilidad
La información y las publicaciones no constituyen, ni deben considerarse como, asesoramiento o recomendaciones financieras, de inversión, de trading u otro tipo, proporcionadas o respaldadas por TradingView. Obtenga más información en Condiciones de uso.