Zero G Order Blocks
# Zero G Order Blocks
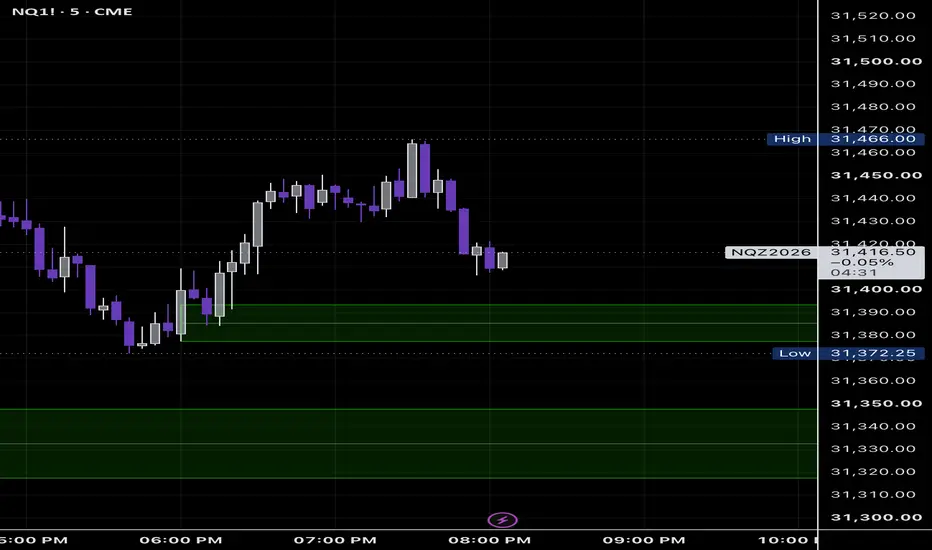
Zero G Order Blocks is a chart-analysis indicator from Zero G Trading designed to identify, display, and track bullish and bearish order-block zones using price and volume-derived pivot conditions.
The indicator is intended for discretionary chart analysis. It does not generate automated trades, execute orders, or present historical strategy-performance results.
## HOW IT WORKS
Zero G Order Blocks evaluates volume pivot conditions and the surrounding price structure to identify qualifying bullish and bearish zones.
When a qualifying pivot is confirmed, the indicator uses the source candle's price range to construct the corresponding zone.
For bullish blocks, the zone extends from the source candle's low to the midpoint of its range.
For bearish blocks, the zone extends from the midpoint of the source candle's range to its high.
Once detected, zones extend forward on the chart so traders can monitor how price interacts with them over time.
A zone continues to be tracked until it is mitigated according to the selected mitigation method, exceeds the optional maximum-age setting, or is removed because of the configured storage limit.
Users can choose between wick-based and close-based mitigation. Touching the outside edge of a zone alone does not necessarily invalidate it.
## DETECTION SETTINGS
The pivot length controls how selective the detection process is.
The default setting uses a 5-bar pivot structure, while faster 3-bar and 2-bar options are available along with a custom setting.
Changing the pivot length changes which price structures qualify as blocks. Lower values generally create more frequent detections, while higher values require a more established pivot structure.
## ZONE STATES
Zones can be classified visually as fresh or tested.
A fresh zone has not been revisited by subsequent price action.
A zone becomes tested when a later candle's range first overlaps the zone.
A tested zone should not be interpreted as confirmed support or resistance. The classification only describes whether price has returned to that area.
Optional fading and labels can be used to distinguish fresh and previously tested zones.
## CHART DISPLAY
Users can configure:
• Number of visible bullish and bearish zones
• Bullish and bearish zone colors
• Zone transparency
• Midpoint-line visibility and appearance
• Fresh/tested labels
• Fading of previously tested zones
• Maximum zone age
• Mitigation behavior
By default, the indicator displays the three most recent surviving zones in each direction with midpoint lines enabled.
Green represents bullish zones and red represents bearish zones using the default settings. These colors can be changed by the user.
## REAL-TIME AND CANDLE-CLOSE UPDATES
The indicator can evaluate developing conditions during the current candle or wait until the candle closes before confirming zone-related events.
When "Wait for candle close" is enabled, zone events are processed only after the relevant candle closes.
This setting does not eliminate the confirmation period required by the underlying pivot calculation.
## IMPORTANT: DETECTION TIMING
Pivot-based detection requires future candles before a historical pivot can be confirmed.
For example, with the default 5-bar pivot setting, five subsequent bars are required before the source pivot can be identified.
If "Start boxes at source candle" is enabled, the indicator draws the resulting zone back to the original source candle after confirmation.
This does not mean that the zone was known in real time on that original candle. The zone only becomes available after the required confirmation bars have occurred.
When using live updates, developing zones or markers may also change before the detection candle closes.
## ALERTS
Optional TradingView alert conditions are available for:
• Bullish block detection
• Bearish block detection
• First bullish-zone retest
• First bearish-zone retest
• Bullish-zone mitigation
• Bearish-zone mitigation
Alert conditions are disabled by default and can be enabled through the indicator settings.
## LIMITATIONS
Order blocks displayed by this indicator are algorithmically identified chart zones based on price and volume-derived conditions.
They do not represent verified institutional orders, exchange order-book positioning, or guaranteed support and resistance.
Because pivot confirmation requires subsequent candles, historical zones may visually begin before the point at which they became detectable in real time.
Different pivot lengths and mitigation settings can materially change the zones displayed.
Zero G Order Blocks is a chart-analysis indicator from Zero G Trading designed to identify, display, and track bullish and bearish order-block zones using price and volume-derived pivot conditions.
The indicator is intended for discretionary chart analysis. It does not generate automated trades, execute orders, or present historical strategy-performance results.
## HOW IT WORKS
Zero G Order Blocks evaluates volume pivot conditions and the surrounding price structure to identify qualifying bullish and bearish zones.
When a qualifying pivot is confirmed, the indicator uses the source candle's price range to construct the corresponding zone.
For bullish blocks, the zone extends from the source candle's low to the midpoint of its range.
For bearish blocks, the zone extends from the midpoint of the source candle's range to its high.
Once detected, zones extend forward on the chart so traders can monitor how price interacts with them over time.
A zone continues to be tracked until it is mitigated according to the selected mitigation method, exceeds the optional maximum-age setting, or is removed because of the configured storage limit.
Users can choose between wick-based and close-based mitigation. Touching the outside edge of a zone alone does not necessarily invalidate it.
## DETECTION SETTINGS
The pivot length controls how selective the detection process is.
The default setting uses a 5-bar pivot structure, while faster 3-bar and 2-bar options are available along with a custom setting.
Changing the pivot length changes which price structures qualify as blocks. Lower values generally create more frequent detections, while higher values require a more established pivot structure.
## ZONE STATES
Zones can be classified visually as fresh or tested.
A fresh zone has not been revisited by subsequent price action.
A zone becomes tested when a later candle's range first overlaps the zone.
A tested zone should not be interpreted as confirmed support or resistance. The classification only describes whether price has returned to that area.
Optional fading and labels can be used to distinguish fresh and previously tested zones.
## CHART DISPLAY
Users can configure:
• Number of visible bullish and bearish zones
• Bullish and bearish zone colors
• Zone transparency
• Midpoint-line visibility and appearance
• Fresh/tested labels
• Fading of previously tested zones
• Maximum zone age
• Mitigation behavior
By default, the indicator displays the three most recent surviving zones in each direction with midpoint lines enabled.
Green represents bullish zones and red represents bearish zones using the default settings. These colors can be changed by the user.
## REAL-TIME AND CANDLE-CLOSE UPDATES
The indicator can evaluate developing conditions during the current candle or wait until the candle closes before confirming zone-related events.
When "Wait for candle close" is enabled, zone events are processed only after the relevant candle closes.
This setting does not eliminate the confirmation period required by the underlying pivot calculation.
## IMPORTANT: DETECTION TIMING
Pivot-based detection requires future candles before a historical pivot can be confirmed.
For example, with the default 5-bar pivot setting, five subsequent bars are required before the source pivot can be identified.
If "Start boxes at source candle" is enabled, the indicator draws the resulting zone back to the original source candle after confirmation.
This does not mean that the zone was known in real time on that original candle. The zone only becomes available after the required confirmation bars have occurred.
When using live updates, developing zones or markers may also change before the detection candle closes.
## ALERTS
Optional TradingView alert conditions are available for:
• Bullish block detection
• Bearish block detection
• First bullish-zone retest
• First bearish-zone retest
• Bullish-zone mitigation
• Bearish-zone mitigation
Alert conditions are disabled by default and can be enabled through the indicator settings.
## LIMITATIONS
Order blocks displayed by this indicator are algorithmically identified chart zones based on price and volume-derived conditions.
They do not represent verified institutional orders, exchange order-book positioning, or guaranteed support and resistance.
Because pivot confirmation requires subsequent candles, historical zones may visually begin before the point at which they became detectable in real time.
Different pivot lengths and mitigation settings can materially change the zones displayed.

Exención de responsabilidad
La información y las publicaciones no constituyen, ni deben considerarse como, asesoramiento o recomendaciones financieras, de inversión, de trading u otro tipo, proporcionadas o respaldadas por TradingView. Obtenga más información en Condiciones de uso.
Exención de responsabilidad
La información y las publicaciones no constituyen, ni deben considerarse como, asesoramiento o recomendaciones financieras, de inversión, de trading u otro tipo, proporcionadas o respaldadas por TradingView. Obtenga más información en Condiciones de uso.