OPEN-SOURCE SCRIPT
Bitcoin Halving Time Projections | Astral Vision
Bitcoin Halving Time Projections | Astral Vision 🌠💠
Bitcoin's halving events cut the block reward in half approximately every four years, structurally reducing the rate of new supply issuance.
Across every completed cycle, price has followed a remarkably consistent temporal pattern relative to the halving date: a prolonged accumulation window in the months preceding it, and a distribution window in the months following it before the subsequent cycle peak.
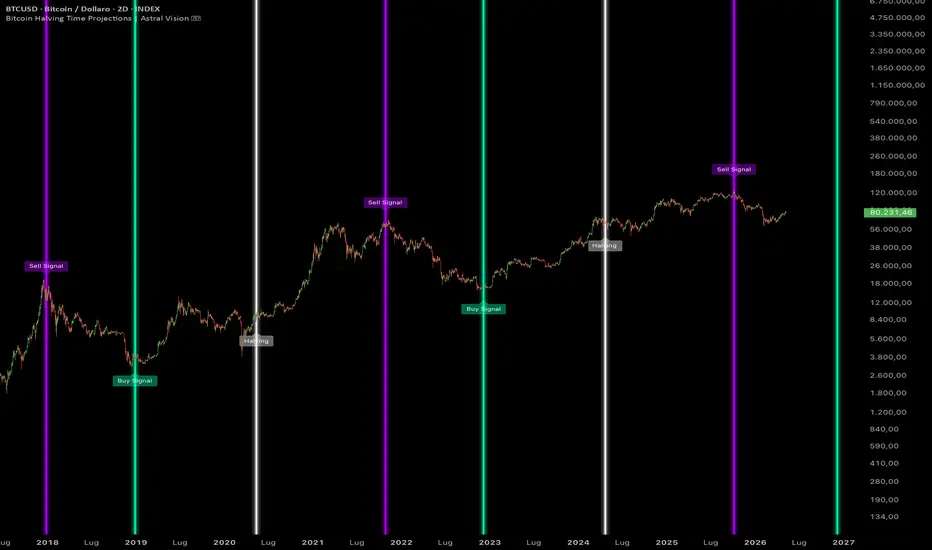
This indicator encodes that pattern as fixed time offsets from each halving date, projecting three vertical markers per cycle (a buy window opening before the halving, the halving itself, and a sell window closing after it) across all historical halvings and forward into the next projected event.
All five halvings from 2012 through the projected 2028 event are included.
Calculation ⚙️
`Buy Signal = Halving date − 500 days`
`Sell Signal = Halving date + 535 days`
Both offsets are fixed constants derived from the historical temporal structure of Bitcoin's halving cycles. The halving dates for events 1 through 4 are hardcoded to their actual timestamps; the fifth is projected based on the expected block schedule. All markers are rendered at the last bar and extended across the full chart using time-based coordinates, making them visible at any chart resolution.
Plots 📊
Inputs 🎛️
Colors 🎨
5 Astral Vision presets + custom override. Default: Futura. Positive color applies to buy signal lines; negative color applies to sell signal lines. The halving line has its own independent color input separate from the theme system.
Purpose 🎯
Most halving indicators mark only the halving date itself, providing no actionable context about when historically the optimal accumulation and distribution windows have opened and closed relative to it. The halving date alone tells you the supply event happened, it does not tell you where you are in the cycle's temporal structure.
This indicator maps the full three-point cycle geometry onto the chart for all five halvings simultaneously, making the historical alignment between time offsets and price behavior directly visible without any manual calculation. The forward projection of the 2028 halving extends the same framework into the current cycle, giving traders a concrete temporal reference for where the buy and sell windows are expected to fall, not as a prediction, but as a historically grounded structural anchor.
Disclaimer ⭕️
It is not financial advice, not an investment recommendation, and not affiliated with any financial institution, research firm, or organization of any kind. All content is provided for educational and informational purposes only. Always conduct your own research before making any financial decision.
Bitcoin's halving events cut the block reward in half approximately every four years, structurally reducing the rate of new supply issuance.
Across every completed cycle, price has followed a remarkably consistent temporal pattern relative to the halving date: a prolonged accumulation window in the months preceding it, and a distribution window in the months following it before the subsequent cycle peak.
This indicator encodes that pattern as fixed time offsets from each halving date, projecting three vertical markers per cycle (a buy window opening before the halving, the halving itself, and a sell window closing after it) across all historical halvings and forward into the next projected event.
All five halvings from 2012 through the projected 2028 event are included.
Calculation ⚙️
`Buy Signal = Halving date − 500 days`
`Sell Signal = Halving date + 535 days`
Both offsets are fixed constants derived from the historical temporal structure of Bitcoin's halving cycles. The halving dates for events 1 through 4 are hardcoded to their actual timestamps; the fifth is projected based on the expected block schedule. All markers are rendered at the last bar and extended across the full chart using time-based coordinates, making them visible at any chart resolution.
Plots 📊
- Buy Signal vertical line per halving 500 days before the event, rendered with a 3-layer glow (widths 12/6/2, transparencies 85/60/0)
- Halving vertical line per event rendered with the same 3-layer glow in a dedicated halving color
- Sell Signal vertical line per halving 535 days after the event, same glow rendering
- Labels at each marker identifying the event type (Buy Signal, Halving, Sell Signal)
Inputs 🎛️
- `Halving Color`: independent color for the halving date lines (default white)
- Buy and sell offsets (500 / 535 days) are fixed constants, not exposed as inputs, to preserve the integrity of the historical cycle structure
Colors 🎨
5 Astral Vision presets + custom override. Default: Futura. Positive color applies to buy signal lines; negative color applies to sell signal lines. The halving line has its own independent color input separate from the theme system.
Purpose 🎯
Most halving indicators mark only the halving date itself, providing no actionable context about when historically the optimal accumulation and distribution windows have opened and closed relative to it. The halving date alone tells you the supply event happened, it does not tell you where you are in the cycle's temporal structure.
This indicator maps the full three-point cycle geometry onto the chart for all five halvings simultaneously, making the historical alignment between time offsets and price behavior directly visible without any manual calculation. The forward projection of the 2028 halving extends the same framework into the current cycle, giving traders a concrete temporal reference for where the buy and sell windows are expected to fall, not as a prediction, but as a historically grounded structural anchor.
Disclaimer ⭕️
It is not financial advice, not an investment recommendation, and not affiliated with any financial institution, research firm, or organization of any kind. All content is provided for educational and informational purposes only. Always conduct your own research before making any financial decision.
Script de código abierto
Fiel al espíritu de TradingView, el creador de este script lo ha convertido en código abierto, para que los traders puedan revisar y verificar su funcionalidad. ¡Enhorabuena al autor! Aunque puede utilizarlo de forma gratuita, recuerde que cualquier republicación del código está sujeta a nuestras Normas internas.

My premium indicators are available on Whop:
whop.com/astralvision
Astral Vision 🌠💠
whop.com/astralvision
Astral Vision 🌠💠
Exención de responsabilidad
La información y las publicaciones no constituyen, ni deben considerarse como, asesoramiento o recomendaciones financieras, de inversión, de trading u otro tipo, proporcionadas o respaldadas por TradingView. Obtenga más información en Condiciones de uso.
Script de código abierto
Fiel al espíritu de TradingView, el creador de este script lo ha convertido en código abierto, para que los traders puedan revisar y verificar su funcionalidad. ¡Enhorabuena al autor! Aunque puede utilizarlo de forma gratuita, recuerde que cualquier republicación del código está sujeta a nuestras Normas internas.
My premium indicators are available on Whop:
whop.com/astralvision
Astral Vision 🌠💠
whop.com/astralvision
Astral Vision 🌠💠
Exención de responsabilidad
La información y las publicaciones no constituyen, ni deben considerarse como, asesoramiento o recomendaciones financieras, de inversión, de trading u otro tipo, proporcionadas o respaldadas por TradingView. Obtenga más información en Condiciones de uso.