OPEN-SOURCE SCRIPT
Actualizado Kaufman's Efficiency Ratio Indicator
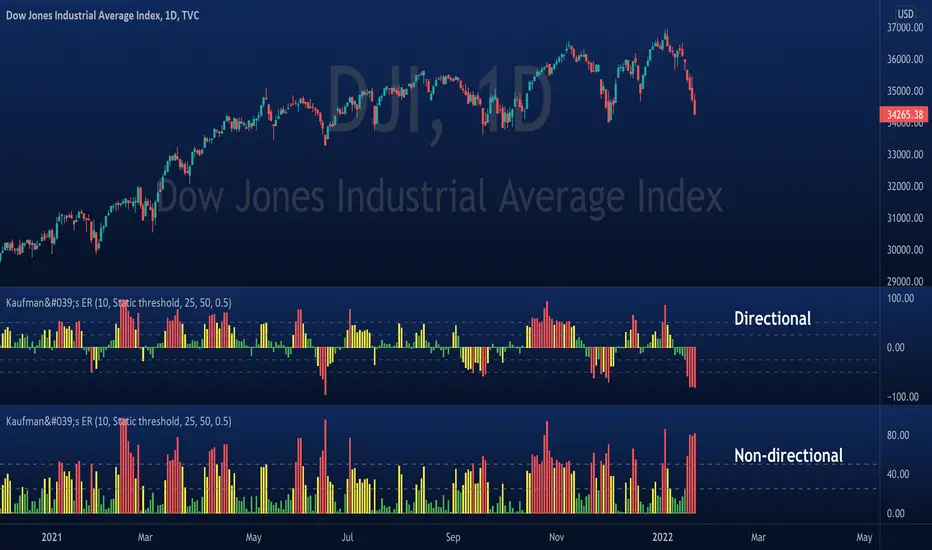
Kaufman Efficiency Ratio ("ER")
This ratio was developed by a systematic trader by the name of Perry J. Kaufman.
Formula
The formula is:
= A divided by B,
where:
Under default settings, closing price is used as source data, and the ER value is expressed in +ve/-ve signs (non-absolute), representing whether price had moved upward/downward over the period.
What this script does:
This script plots out ER and fills in the area beneath the curve with colors according to whether ER is classified as low/medium/high. There are two modes:
- Dynamic mode: low/medium/high is determined by ER value relative to it's mean +/- 'multiple' of standard deviation
- Static mode: low/medium/high is based on user defined thresholds
Applications:
- Can be used for identifying bullish moves in instances where price had already gone up steeply, but rests. If speculating that price will continually rise, then can enter during resting phase.
- Can be used to filter out choppy entry signals produced by existing trade strategies. If trying to enter during periods of consolidation, then ER should ideally be low. On the other hand, for mean reversion strategies, ER should be expected high.
This ratio was developed by a systematic trader by the name of Perry J. Kaufman.
Formula
The formula is:
= A divided by B,
where:
- A = Current closing price minus the closing price at the start of the lookback period
- B = Sum of differences between closing prices (in absolute terms) of consecutive bars over the lookback period
Under default settings, closing price is used as source data, and the ER value is expressed in +ve/-ve signs (non-absolute), representing whether price had moved upward/downward over the period.
What this script does:
This script plots out ER and fills in the area beneath the curve with colors according to whether ER is classified as low/medium/high. There are two modes:
- Dynamic mode: low/medium/high is determined by ER value relative to it's mean +/- 'multiple' of standard deviation
- Static mode: low/medium/high is based on user defined thresholds
Applications:
- Can be used for identifying bullish moves in instances where price had already gone up steeply, but rests. If speculating that price will continually rise, then can enter during resting phase.
- Can be used to filter out choppy entry signals produced by existing trade strategies. If trying to enter during periods of consolidation, then ER should ideally be low. On the other hand, for mean reversion strategies, ER should be expected high.
Notas de prensa
Can choose between three color modes: (1) Static, (2) Dynamic, and (3) No colorClarification: In Kaufman's book "Trading Systems and Methods", he compares price movements in a high noise market to the analogy of a "drunken sailor trying to walk a straight line". On the other hand, if a market displays no noise, price should be nicely trending straight. Following is an illustration of what this all means:
Notas de prensa
- switched to using histogram- added horizontal dash lines
Script de código abierto
Fiel al espíritu de TradingView, el creador de este script lo ha convertido en código abierto, para que los traders puedan revisar y verificar su funcionalidad. ¡Enhorabuena al autor! Aunque puede utilizarlo de forma gratuita, recuerde que cualquier republicación del código está sujeta a nuestras Normas internas.

Exención de responsabilidad
La información y las publicaciones no constituyen, ni deben considerarse como, asesoramiento o recomendaciones financieras, de inversión, de trading u otro tipo, proporcionadas o respaldadas por TradingView. Obtenga más información en Condiciones de uso.
Script de código abierto
Fiel al espíritu de TradingView, el creador de este script lo ha convertido en código abierto, para que los traders puedan revisar y verificar su funcionalidad. ¡Enhorabuena al autor! Aunque puede utilizarlo de forma gratuita, recuerde que cualquier republicación del código está sujeta a nuestras Normas internas.
Exención de responsabilidad
La información y las publicaciones no constituyen, ni deben considerarse como, asesoramiento o recomendaciones financieras, de inversión, de trading u otro tipo, proporcionadas o respaldadas por TradingView. Obtenga más información en Condiciones de uso.