Standard Deviation Channel (Auto)
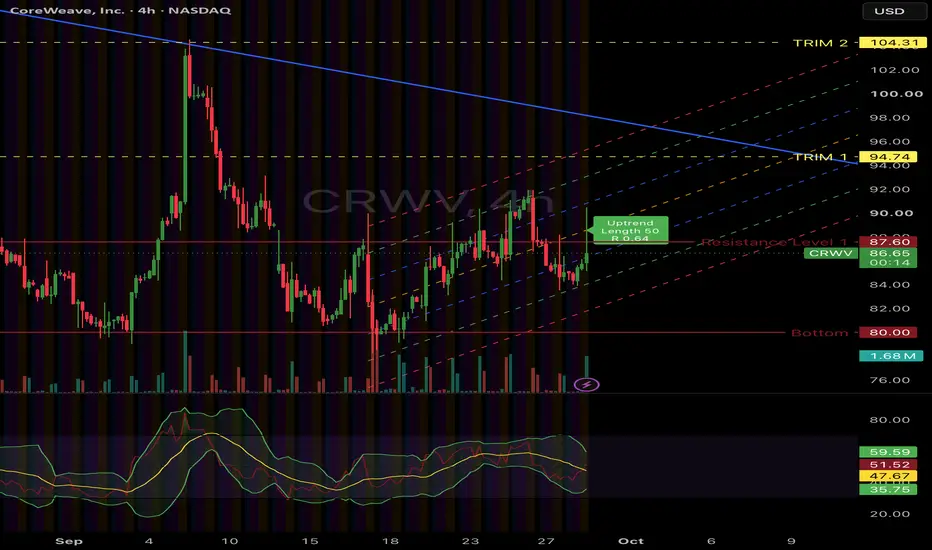
A regression channel inspired by the ThinkorSwim Standard Deviation Channel. It finds the trend length for you.
HOW IT WORKS
1. The script draws a straight line through recent price (linear regression).
2. It draws bands above and below that line at 1, 2, and 3 standard deviations. Standard deviation is a measure of how far price usually strays from the line.
3. In Auto mode, it tests many lengths. It keeps the length where price follows the line best, using the highest |Pearson R|. Pearson R is a score from 0 to 1 for how straight the trend is.
4. A small label shows the trend (up, down, or none), the length it chose, and R. If |R| is below your minimum, the label says "No clear trend".
SETTINGS
- Auto length: on or off. Off uses your Manual length.
- Auto min length, max length, and step: the range of lengths it tests.
- Min |R|: how strong R must be to call it a trend.
- Each level (1, 2, 3) has its own show box, deviation number, color, width, style, and fill.
- The middle line has its own color, width, and style.
- Extend lines left or right.
NOTES
- Short windows can score a high R by chance. If the channel looks too short, raise the min length.
- Auto mode picks the best R out of many lengths, so treat R as a guide, not proof.
- This is not an exact copy of ThinkorSwim. The deviation math may differ a little.
- The lines redraw when new bars arrive. Auto mode may pick a new length.
- For learning only. This is not financial advice.
HOW IT WORKS
1. The script draws a straight line through recent price (linear regression).
2. It draws bands above and below that line at 1, 2, and 3 standard deviations. Standard deviation is a measure of how far price usually strays from the line.
3. In Auto mode, it tests many lengths. It keeps the length where price follows the line best, using the highest |Pearson R|. Pearson R is a score from 0 to 1 for how straight the trend is.
4. A small label shows the trend (up, down, or none), the length it chose, and R. If |R| is below your minimum, the label says "No clear trend".
SETTINGS
- Auto length: on or off. Off uses your Manual length.
- Auto min length, max length, and step: the range of lengths it tests.
- Min |R|: how strong R must be to call it a trend.
- Each level (1, 2, 3) has its own show box, deviation number, color, width, style, and fill.
- The middle line has its own color, width, and style.
- Extend lines left or right.
NOTES
- Short windows can score a high R by chance. If the channel looks too short, raise the min length.
- Auto mode picks the best R out of many lengths, so treat R as a guide, not proof.
- This is not an exact copy of ThinkorSwim. The deviation math may differ a little.
- The lines redraw when new bars arrive. Auto mode may pick a new length.
- For learning only. This is not financial advice.

Exención de responsabilidad
La información y las publicaciones no constituyen, ni deben considerarse como, asesoramiento o recomendaciones financieras, de inversión, de trading u otro tipo, proporcionadas o respaldadas por TradingView. Obtenga más información en Condiciones de uso.
Exención de responsabilidad
La información y las publicaciones no constituyen, ni deben considerarse como, asesoramiento o recomendaciones financieras, de inversión, de trading u otro tipo, proporcionadas o respaldadas por TradingView. Obtenga más información en Condiciones de uso.