Volume Stats Dashboard
# Volume Stats Dashboard
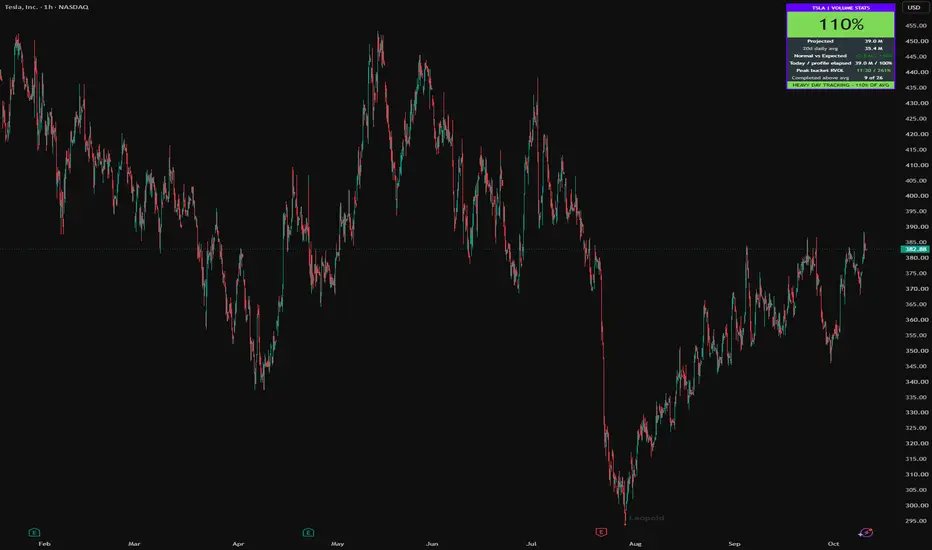
Volume Stats is a compact **dashboard over the price chart** that compares today's volume with historical session patterns and estimates end-of-day volume.
## Getting started
Add the indicator to a standard time-based **1-minute through 1-hour chart** of a symbol with daily and intraday volume. Some cash indexes may not supply volume; use a volume-bearing symbol when the dashboard reports missing data.
## Model and controls
- The prior 20 valid daily volumes set the baseline; today's daily bar is excluded.
- A regular-session 15-minute feed builds 26 buckets from **09:30 to 16:00 America/New_York**, independent of chart timeframe and extended-hours display.
- The last 10 observed prior sessions supply each bucket's median or mean. At least three valid samples per bucket are required. Partial sessions can reduce available depth; early-close days still use the fixed 16:00 model.
- Expected volume is daily average multiplied by elapsed profile fraction. A forming bucket contributes its **whole expected bucket**, not a minute-prorated fraction.
- Projected volume is today's daily volume divided by that fraction. Projection starts at **5%** of the profile and is considered settled at **20%**.
- Today's bucket volume is scaled by daily volume / elapsed intraday volume. The summary uses only completed buckets and caps RVOL at **300%**.
- Tier boundaries: below 50% red, 50-79% yellow, 80-89% orange, 90-105% green, above 105% lime.
- Seven themes, panel visibility, bucket summary, state banner, footer timestamp, UI scale, profile settings, and alert thresholds remain configurable. UI scale uses font-size presets rather than exact pixel sizing.
- **Volume Days** defaults to 20; **Stats Profile Days** defaults to 10; **Profile Collapse** defaults to Median.
The dashboard presents numeric summaries rather than separate volume curves, fan bands, projection drawings, or RVOL bar charts.
## Dashboard rows
| Row | Meaning |
| --- | --- |
| Ticker / VOLUME STATS | Centered header spanning both columns. |
| Large percentage | Projected end-of-day volume as a percentage of the daily average, with tier coloring after the projection settles. |
| Projected | Estimated end-of-day volume. |
| Daily avg | Average daily volume and the number of valid days used. |
| Normal vs Expected | Today's volume minus expected volume at the current profile point, followed by the signed percentage difference relative to expected volume. |
| Today / profile elapsed | Today's daily volume and the percentage of the volume profile elapsed, not the percentage of clock time elapsed. |
| Peak bucket RVOL | Start time and scaled RVOL of the strongest completed 15-minute bucket, capped at 300%. |
| Completed above avg | Completed buckets above 100% RVOL out of the completed buckets with valid data. |
| State banner | Full-width status: HEAVY DAY TRACKING, ON STATS, SLIGHTLY LIGHT, LIGHT TAPE, DEAD TAPE, or a data/warmup message. |
| Footer timestamp | Optional full-width timestamp in New York time. Disabled by default. |
The header, large percentage, state banner, and footer span both columns. Optional bucket, banner, and footer rows are allocated only when enabled, so disabling them leaves no blank rows.
## Alerts and data behavior
Configure an alert using **Volume Stats Negative** or **Projected Volume Above Average**. They use the rounded projected percentage with strict comparisons: below 90% and above 100% by default. They are state conditions, not one-time threshold crossings. Chart-bar-close evaluation is enabled by default and can be disabled.
The model does not use future daily volume in historical intraday signals. On live bars, developing daily volume and the current 15-minute bucket update as the feed updates. On historical intraday bars, the current daily value is normally available only at the daily close, so this dashboard is **not a reconstruction of historical intraday composite-volume projections**. Historical readings should not be assumed to reproduce live snapshots. Developing values can change before confirmation; bar-close alerts do not freeze a still-developing higher-timeframe feed.
Daily and intraday volume may differ across data providers. Identical numbers across feeds are not guaranteed. The fixed US cash-session model is not appropriate for 24-hour markets or other exchange sessions without adaptation.
## Verification
Before relying on the dashboard, confirm the default display, Median/Mean changes, missing-volume messages, panel visibility, full-width rows, no gaps when optional rows are disabled, the **Normal vs Expected** label, footer, and both alert conditions using a live volume feed.
Volume Stats is a compact **dashboard over the price chart** that compares today's volume with historical session patterns and estimates end-of-day volume.
## Getting started
Add the indicator to a standard time-based **1-minute through 1-hour chart** of a symbol with daily and intraday volume. Some cash indexes may not supply volume; use a volume-bearing symbol when the dashboard reports missing data.
## Model and controls
- The prior 20 valid daily volumes set the baseline; today's daily bar is excluded.
- A regular-session 15-minute feed builds 26 buckets from **09:30 to 16:00 America/New_York**, independent of chart timeframe and extended-hours display.
- The last 10 observed prior sessions supply each bucket's median or mean. At least three valid samples per bucket are required. Partial sessions can reduce available depth; early-close days still use the fixed 16:00 model.
- Expected volume is daily average multiplied by elapsed profile fraction. A forming bucket contributes its **whole expected bucket**, not a minute-prorated fraction.
- Projected volume is today's daily volume divided by that fraction. Projection starts at **5%** of the profile and is considered settled at **20%**.
- Today's bucket volume is scaled by daily volume / elapsed intraday volume. The summary uses only completed buckets and caps RVOL at **300%**.
- Tier boundaries: below 50% red, 50-79% yellow, 80-89% orange, 90-105% green, above 105% lime.
- Seven themes, panel visibility, bucket summary, state banner, footer timestamp, UI scale, profile settings, and alert thresholds remain configurable. UI scale uses font-size presets rather than exact pixel sizing.
- **Volume Days** defaults to 20; **Stats Profile Days** defaults to 10; **Profile Collapse** defaults to Median.
The dashboard presents numeric summaries rather than separate volume curves, fan bands, projection drawings, or RVOL bar charts.
## Dashboard rows
| Row | Meaning |
| --- | --- |
| Ticker / VOLUME STATS | Centered header spanning both columns. |
| Large percentage | Projected end-of-day volume as a percentage of the daily average, with tier coloring after the projection settles. |
| Projected | Estimated end-of-day volume. |
| Daily avg | Average daily volume and the number of valid days used. |
| Normal vs Expected | Today's volume minus expected volume at the current profile point, followed by the signed percentage difference relative to expected volume. |
| Today / profile elapsed | Today's daily volume and the percentage of the volume profile elapsed, not the percentage of clock time elapsed. |
| Peak bucket RVOL | Start time and scaled RVOL of the strongest completed 15-minute bucket, capped at 300%. |
| Completed above avg | Completed buckets above 100% RVOL out of the completed buckets with valid data. |
| State banner | Full-width status: HEAVY DAY TRACKING, ON STATS, SLIGHTLY LIGHT, LIGHT TAPE, DEAD TAPE, or a data/warmup message. |
| Footer timestamp | Optional full-width timestamp in New York time. Disabled by default. |
The header, large percentage, state banner, and footer span both columns. Optional bucket, banner, and footer rows are allocated only when enabled, so disabling them leaves no blank rows.
## Alerts and data behavior
Configure an alert using **Volume Stats Negative** or **Projected Volume Above Average**. They use the rounded projected percentage with strict comparisons: below 90% and above 100% by default. They are state conditions, not one-time threshold crossings. Chart-bar-close evaluation is enabled by default and can be disabled.
The model does not use future daily volume in historical intraday signals. On live bars, developing daily volume and the current 15-minute bucket update as the feed updates. On historical intraday bars, the current daily value is normally available only at the daily close, so this dashboard is **not a reconstruction of historical intraday composite-volume projections**. Historical readings should not be assumed to reproduce live snapshots. Developing values can change before confirmation; bar-close alerts do not freeze a still-developing higher-timeframe feed.
Daily and intraday volume may differ across data providers. Identical numbers across feeds are not guaranteed. The fixed US cash-session model is not appropriate for 24-hour markets or other exchange sessions without adaptation.
## Verification
Before relying on the dashboard, confirm the default display, Median/Mean changes, missing-volume messages, panel visibility, full-width rows, no gaps when optional rows are disabled, the **Normal vs Expected** label, footer, and both alert conditions using a live volume feed.

Exención de responsabilidad
La información y las publicaciones no constituyen, ni deben considerarse como, asesoramiento o recomendaciones financieras, de inversión, de trading u otro tipo, proporcionadas o respaldadas por TradingView. Obtenga más información en Condiciones de uso.
Exención de responsabilidad
La información y las publicaciones no constituyen, ni deben considerarse como, asesoramiento o recomendaciones financieras, de inversión, de trading u otro tipo, proporcionadas o respaldadas por TradingView. Obtenga más información en Condiciones de uso.