Previous Day High Low (PDH PDL) Dated
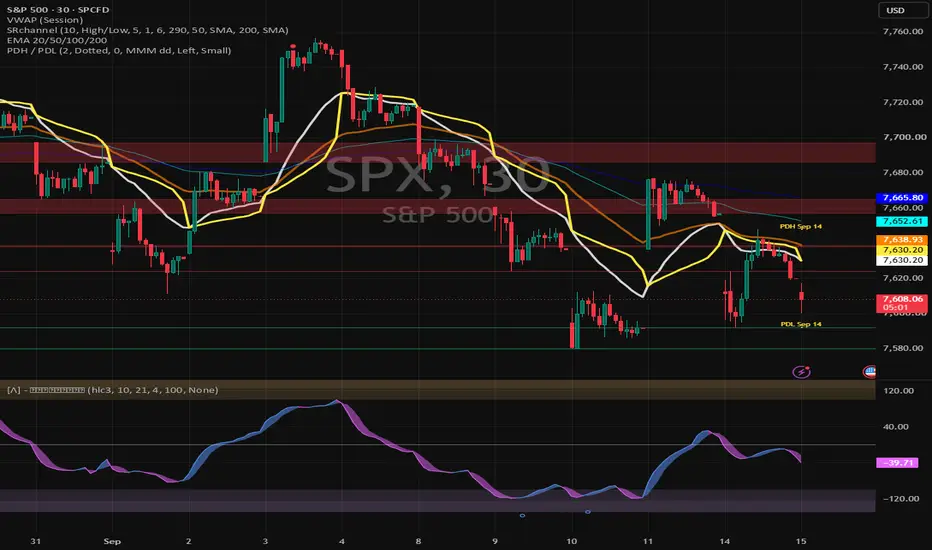
Here's a description you can paste into TradingView's publish form. I've kept it to what moderators look for: what it does, how it works, and how to use it, with no performance claims.
---
**Title:** Previous Day High / Low (PDH / PDL) — Dated
**Short title:** PDH / PDL
---
**Description:**
Marks the high and low of the previous trading day as two horizontal lines across the current session, with the source date printed on each line.
The previous day's range is one of the most widely watched reference levels in intraday trading. Price tends to react at yesterday's extremes — they act as obvious targets for continuation and as natural points for rejection. Most charts either leave you to eyeball those levels or clutter the screen with a week of stale lines. This one draws a single pair and tells you exactly which date they came from.
**How it works**
Yesterday's high and low are pulled from the daily timeframe using a security call with a one-bar offset and lookahead enabled. That combination returns only the last *closed* daily bar, so the values lock in the moment a new day opens and never shift afterwards. The levels do not repaint.
New days are detected from the daily timestamp rather than from bar counts, and the lines are anchored to time coordinates instead of bar indices. Both choices mean the script behaves the same on a 1-minute chart as on a 1-hour or daily chart, including on symbols with irregular sessions or gaps in data.
When a new session begins, the previous day's drawings are deleted and one fresh pair is created. Only ever one high line, one low line, and their labels exist on the chart.
**How to use it**
Add it to any intraday chart. The lines run from the session open to the live bar. Watch for:
- Breaks above PDH or below PDL as range expansion
- Failure and rejection at either level as a reversal signal
- The gap between the two as the prior day's value area, useful for gauging whether today is trending or rotating
Two alert conditions are included: *Cross above PDH* and *Cross below PDL*.
**Settings**
- **Regular trading hours only** — builds the daily range from the regular session, ignoring pre- and post-market. Useful for stocks; leave off for futures and crypto.
- **Line style** — colour, width (1–5), and dotted / dashed / solid. Defaults to yellow, width 2, dotted.
- **Extend right** — push the lines past the live bar by a set number of bars.
- **Label** — toggle on or off, choose the date format (MMM dd, dd/MM, yyyy-MM-dd, and others), optionally prefix with PDH/PDL or append the price, position left or right, set size and colour, and switch between plain text and a bubble.
**Note**
On weekly and monthly charts a "previous day" doesn't correspond to a bar, so the levels there are informational only. The indicator is intended for intraday and daily use.
---
Two things worth deciding before you hit publish: whether to release it as **open-source** (recommended — TradingView's house rules favour it, and a script this simple gains nothing from being protected), and whether to add a chart screenshot on a liquid symbol like ES or SPY with the lines clearly visible. The published snapshot is the first thing people judge, so set the chart up cleanly before you publish.
---
**Title:** Previous Day High / Low (PDH / PDL) — Dated
**Short title:** PDH / PDL
---
**Description:**
Marks the high and low of the previous trading day as two horizontal lines across the current session, with the source date printed on each line.
The previous day's range is one of the most widely watched reference levels in intraday trading. Price tends to react at yesterday's extremes — they act as obvious targets for continuation and as natural points for rejection. Most charts either leave you to eyeball those levels or clutter the screen with a week of stale lines. This one draws a single pair and tells you exactly which date they came from.
**How it works**
Yesterday's high and low are pulled from the daily timeframe using a security call with a one-bar offset and lookahead enabled. That combination returns only the last *closed* daily bar, so the values lock in the moment a new day opens and never shift afterwards. The levels do not repaint.
New days are detected from the daily timestamp rather than from bar counts, and the lines are anchored to time coordinates instead of bar indices. Both choices mean the script behaves the same on a 1-minute chart as on a 1-hour or daily chart, including on symbols with irregular sessions or gaps in data.
When a new session begins, the previous day's drawings are deleted and one fresh pair is created. Only ever one high line, one low line, and their labels exist on the chart.
**How to use it**
Add it to any intraday chart. The lines run from the session open to the live bar. Watch for:
- Breaks above PDH or below PDL as range expansion
- Failure and rejection at either level as a reversal signal
- The gap between the two as the prior day's value area, useful for gauging whether today is trending or rotating
Two alert conditions are included: *Cross above PDH* and *Cross below PDL*.
**Settings**
- **Regular trading hours only** — builds the daily range from the regular session, ignoring pre- and post-market. Useful for stocks; leave off for futures and crypto.
- **Line style** — colour, width (1–5), and dotted / dashed / solid. Defaults to yellow, width 2, dotted.
- **Extend right** — push the lines past the live bar by a set number of bars.
- **Label** — toggle on or off, choose the date format (MMM dd, dd/MM, yyyy-MM-dd, and others), optionally prefix with PDH/PDL or append the price, position left or right, set size and colour, and switch between plain text and a bubble.
**Note**
On weekly and monthly charts a "previous day" doesn't correspond to a bar, so the levels there are informational only. The indicator is intended for intraday and daily use.
---
Two things worth deciding before you hit publish: whether to release it as **open-source** (recommended — TradingView's house rules favour it, and a script this simple gains nothing from being protected), and whether to add a chart screenshot on a liquid symbol like ES or SPY with the lines clearly visible. The published snapshot is the first thing people judge, so set the chart up cleanly before you publish.

Exención de responsabilidad
La información y las publicaciones no constituyen, ni deben considerarse como, asesoramiento o recomendaciones financieras, de inversión, de trading u otro tipo, proporcionadas o respaldadas por TradingView. Obtenga más información en Condiciones de uso.
Exención de responsabilidad
La información y las publicaciones no constituyen, ni deben considerarse como, asesoramiento o recomendaciones financieras, de inversión, de trading u otro tipo, proporcionadas o respaldadas por TradingView. Obtenga más información en Condiciones de uso.