OPEN-SOURCE SCRIPT
Actualizado GMS Ultimate Indicator
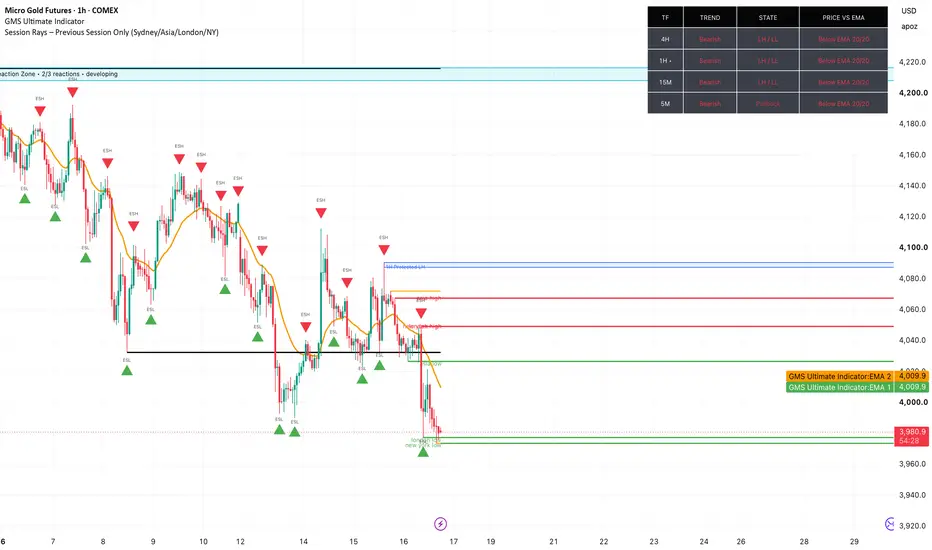
GMS Ultimate Indicator 9.0 is a customizable multi timeframe market structure and price action tool designed to help traders stay aligned with the dominant side of the market.
It analyzes the Daily, 4H, 1H, 15M, 5M, and 1M trends using HH/HL and LH/LL structure, while identifying pullbacks, consolidation, liquidity sweeps, BOS, CHOCH, protected structure, reaction zones, retests, and rejection candles. Its setup engine helps locate higher probability entries within the broader trend, with adjustable alerts, dashboard layouts, and display settings.
For analysis and educational purposes only. Use proper risk management and backtesting.
It analyzes the Daily, 4H, 1H, 15M, 5M, and 1M trends using HH/HL and LH/LL structure, while identifying pullbacks, consolidation, liquidity sweeps, BOS, CHOCH, protected structure, reaction zones, retests, and rejection candles. Its setup engine helps locate higher probability entries within the broader trend, with adjustable alerts, dashboard layouts, and display settings.
For analysis and educational purposes only. Use proper risk management and backtesting.
Notas de prensa
GMS Ultimate Indicator is a customizable multi timeframe market structure and price action tool designed to help traders stay aligned with the market’s direction. It tracks 4H, 1H, 15M, and 5M trend conditions, structure state, and price position relative to selected EMAs.The indicator also identifies BOS, CHOCH, swing highs and lows, liquidity pools and sweeps, previous day/week levels, protected 1H structure, 4H reaction zones, retests, rejection candles, potential setups, targets, and alerts.
Built for scalpers, intraday traders, and swing traders who use market structure and price action. For analysis and educational purposes only.
Notas de prensa
GMS Ultimate Indicator is a customizable multi timeframe market structure and price action tool designed to help traders stay aligned with the market’s direction. It tracks 4H, 1H, 15M, and 5M trend conditions, structure state, and price position relative to selected EMAs.The indicator also identifies BOS, CHOCH, swing highs and lows, liquidity pools and sweeps, previous day/week levels, protected 1H structure, 4H reaction zones, retests, rejection candles, potential setups, targets, and alerts.
Built for scalpers, intraday traders, and swing traders who use market structure and price action. For analysis and educational purposes only.
Notas de prensa
GMS Ultimate Indicator is a customizable multi timeframe market structure and price action tool designed to help traders stay aligned with the market’s direction. It tracks 4H, 1H, 15M, and 5M trend conditions, structure state, and price position relative to selected EMAs.The indicator also identifies BOS, CHOCH, swing highs and lows, liquidity pools and sweeps, previous day/week levels, protected 1H structure, 4H reaction zones, retests, rejection candles, potential setups, targets, and alerts.
Built for scalpers, intraday traders, and swing traders who use market structure and price action. For analysis and educational purposes only.
Notas de prensa
GMS Ultimate Indicator is a customizable multi timeframe market structure and price action tool designed to help traders stay aligned with the market’s direction. It tracks 4H, 1H, 15M, and 5M trend conditions, structure state, and price position relative to selected EMAs.The indicator also identifies BOS, CHOCH, swing highs and lows, liquidity pools and sweeps, previous day/week levels, protected 1H structure, 4H reaction zones, retests, rejection candles, potential setups, targets, and alerts.
Built for scalpers, intraday traders, and swing traders who use market structure and price action. For analysis and educational purposes only.
Notas de prensa
Updated : 12.9GMS Ultimate Indicator is a customizable multi timeframe market structure and price action tool designed to help traders stay aligned with the dominant side of the market.
It analyzes the Daily, 4H, 1H, 15M, 5M, and 1M trends using HH/HL and LH/LL structure, while identifying pullbacks, consolidation, liquidity sweeps, BOS, CHOCH, protected structure, reaction zones, retests, and rejection candles. Its setup engine helps locate higher probability entries within the broader trend, with adjustable alerts, dashboard layouts, and display settings.
For analysis and educational purposes only. Use proper risk management and backtesting.
Notas de prensa
Updated v 13.0 GMS Ultimate Indicator is a customizable multi timeframe market structure and price action tool designed to help traders stay aligned with the dominant side of the market.
It analyzes the Daily, 4H, 1H, 15M, 5M, and 1M trends using HH/HL and LH/LL structure, while identifying pullbacks, consolidation, liquidity sweeps, BOS, CHOCH, protected structure, reaction zones, retests, and rejection candles. Its setup engine helps locate higher probability entries within the broader trend, with adjustable alerts, dashboard layouts, and display settings.
For analysis and educational purposes only. Use proper risk management and backtesting.
Script de código abierto
Fiel al espíritu de TradingView, el creador de este script lo ha convertido en código abierto, para que los traders puedan revisar y verificar su funcionalidad. ¡Enhorabuena al autor! Aunque puede utilizarlo de forma gratuita, recuerde que cualquier republicación del código está sujeta a nuestras Normas internas.

Exención de responsabilidad
La información y las publicaciones no constituyen, ni deben considerarse como, asesoramiento o recomendaciones financieras, de inversión, de trading u otro tipo, proporcionadas o respaldadas por TradingView. Obtenga más información en Condiciones de uso.
Script de código abierto
Fiel al espíritu de TradingView, el creador de este script lo ha convertido en código abierto, para que los traders puedan revisar y verificar su funcionalidad. ¡Enhorabuena al autor! Aunque puede utilizarlo de forma gratuita, recuerde que cualquier republicación del código está sujeta a nuestras Normas internas.
Exención de responsabilidad
La información y las publicaciones no constituyen, ni deben considerarse como, asesoramiento o recomendaciones financieras, de inversión, de trading u otro tipo, proporcionadas o respaldadas por TradingView. Obtenga más información en Condiciones de uso.