OPEN-SOURCE SCRIPT
MFI Distribution [UAlgo]
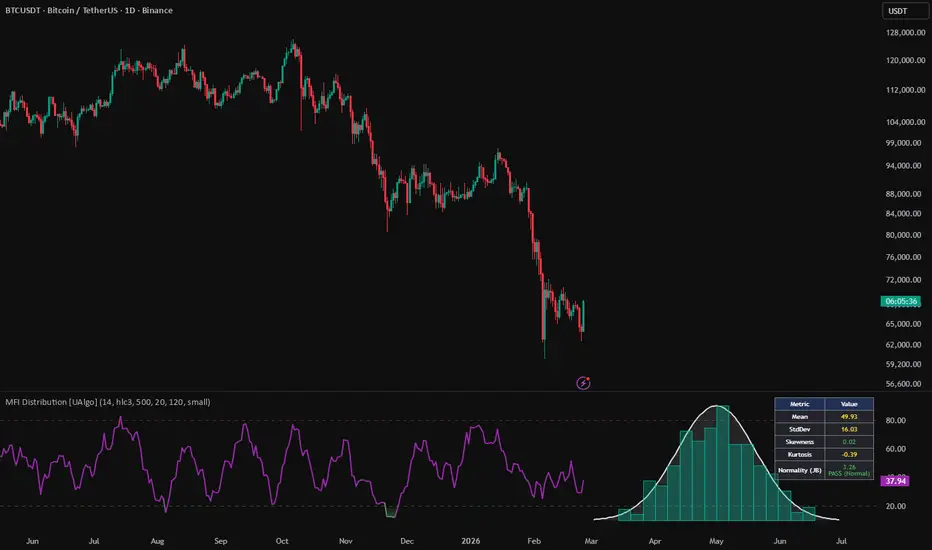
MFI Distribution is a statistics focused Money Flow Index indicator that combines a live MFI oscillator with a forward projected distribution histogram and normality diagnostics. Instead of only showing the current MFI line, the script collects a rolling history of MFI values, studies their distribution over a configurable lookback period, and visualizes the result as a histogram in the oscillator pane.
The indicator is designed for traders who want to understand how MFI behaves as a distribution, not only where it is on the current bar. It provides a compact statistical framework that helps answer questions such as:
Is MFI clustering around a narrow regime or spread across the full range
Is the recent MFI behavior skewed toward strong buying or selling pressure
Does the MFI sample look approximately normal, or is it fat tailed / asymmetric
How extreme is the current reading relative to the recent distribution
To support this, the script includes:
A live MFI line with dynamic gradient coloring
Overbought and oversold visual zones with gradient fills
A histogram of MFI frequency distribution over the selected lookback
An optional Gaussian curve overlay for visual comparison
A statistical dashboard with mean, standard deviation, skewness, kurtosis, and Jarque Bera normality test results
The histogram is drawn into the future area of the pane, so it does not interfere with the live MFI trace while still remaining visually aligned to the 0 to 100 oscillator scale.
Educational tool only. Not financial advice.
🔹 Features
🔸 1) Live MFI Oscillator with Regime Aware Coloring
The script plots a standard MFI line and colors it dynamically based on level behavior:
High MFI values transition toward red tones
Low MFI values transition toward green tones
Mid range values remain purple
This makes the oscillator easier to read at a glance, especially during sustained overbought or oversold conditions.
🔸 2) Overbought and Oversold Zone Visualization
The indicator includes standard MFI reference levels at 80 and 20, then adds gradient fills that become visible when the MFI pushes into extreme zones. This provides better visual emphasis for momentum extremes without cluttering the chart.
🔸 3) Rolling MFI History Collection for Statistical Analysis
The script maintains an internal array of the latest MFI values up to the user defined lookback length. This rolling sample is used to compute all distribution statistics and histogram frequencies on the last bar.
This design keeps the indicator responsive while ensuring the displayed distribution reflects the most recent market behavior.
🔸 4) Forward Projected MFI Distribution Histogram
A histogram is drawn in the oscillator pane using bins over the fixed MFI range from 0 to 100. Each bin counts how many MFI observations fall inside that interval during the lookback window.
The histogram is projected to the right of current price action in the pane, giving users a clean distribution panel without covering the live MFI line.
🔸 5) Configurable Histogram Resolution and Width
Users can control:
Lookback period used for distribution analysis
Number of histogram bins
Visual width of the histogram in future bars
This makes the tool flexible for both high level regime reading and finer distribution inspection.
🔸 6) Optional Gaussian Curve Overlay
When enabled, the script overlays a theoretical normal distribution curve using the sample mean and sample standard deviation. The curve is normalized to the histogram height so users can visually compare the empirical MFI distribution against a bell curve shape.
This is useful for quickly spotting asymmetry, multimodal clustering, or fat tail behavior.
🔸 7) Full Statistical Summary Dashboard
A built in dashboard table displays:
Mean
Standard Deviation
Skewness
Kurtosis (excess kurtosis)
Jarque Bera statistic
Pass / Fail normality status (95% threshold logic)
This turns the indicator into a compact quantitative diagnostic panel, not only a visual oscillator.
🔸 8) Jarque Bera Normality Test Classification
The script evaluates whether the MFI sample is approximately normal using a Jarque Bera style test and a fixed chi square threshold (95% confidence, 2 degrees of freedom). It then marks the result as PASS (Normal) or FAIL (Non Normal).
This helps traders distinguish between more stable oscillator regimes and structurally distorted ones.
🔸 9) Histogram Color Theme Based on Normality Result
The histogram automatically changes style depending on the test result:
Teal themed histogram when normality test passes
Red themed histogram when normality test fails
This creates an immediate visual signal of distribution quality without needing to read the dashboard first.
🔸 10) Last Bar Only Heavy Processing for Efficiency
Statistical calculations, histogram drawing, and dashboard refresh are performed only on the last bar. This reduces object churn and improves performance while preserving real time utility.
🔸 11) Object Based Drawing Management
The script uses custom types to organize logic:
DistributionStats for statistical values and normality output
HistoDrawer for histogram bars, curve lines, and labels
This makes the code structured and easier to extend with future features such as percentiles, z scores, or alternate tests.
🔹 Calculations
1) MFI Calculation
The script computes Money Flow Index from a user selected source and length:
Pine Script®
This value is plotted in the oscillator pane and colored dynamically according to level.
2) Rolling History Buffer for Distribution Sampling
Each valid MFI value is pushed into a rolling array used for statistical analysis:
Pine Script®
This ensures the sample size is capped at the selected lookback and continuously refreshed with recent values.
3) Sample Variance and Standard Deviation
The script computes sample variance using the classic n minus 1 denominator:
Pine Script®
Standard deviation is then calculated as:
Pine Script®
Using sample variance is appropriate here because the lookback window is treated as a sample of recent market behavior.
4) Sample Skewness Calculation
Skewness is computed from standardized deviations and corrected for sample size:
Pine Script®
Interpretation:
Positive skew suggests more mass on lower values with a right tail toward high MFI prints
Negative skew suggests more mass on higher values with a left tail toward low MFI prints
5) Excess Kurtosis Calculation
The script calculates excess kurtosis, where a normal distribution is centered around 0:
Pine Script®
Interpretation:
Positive excess kurtosis suggests heavier tails or more peaked behavior
Negative excess kurtosis suggests flatter distribution behavior
6) Jarque Bera Normality Test
The script uses skewness and excess kurtosis to compute the Jarque Bera statistic:
Pine Script®
Then it compares the result against a 95 percent chi square critical value (2 degrees of freedom):
Pine Script®
Important note:
The code defines a jb_p_value field in the stats type, but this version does not explicitly calculate or display a p value. The pass / fail logic is threshold based.
7) Fixed MFI Range Histogram Binning (0 to 100)
The histogram always bins data over the full MFI range:
Pine Script®
Each MFI value is mapped to a bin index:
Pine Script®
The index is clamped so values at boundaries stay valid:
Pine Script®
This makes the histogram consistent across symbols and timeframes.
8) Frequency Counting and Peak Detection
For each binned MFI observation, the script increments a frequency counter and tracks the highest bin count:
Pine Script®
The maximum frequency is later used to normalize histogram bar heights.
9) Histogram Rendering Geometry
The histogram is drawn as boxes in the oscillator pane, projected to the right of the last bar:
Pine Script®
This effectively uses the MFI pane vertical range from about 10 to 90 for histogram height visualization, keeping it aligned with the oscillator scale.
Each bin is mapped to x coordinates using its MFI interval and the user selected histogram width:
Pine Script®
Each frequency is mapped to a vertical height using:
Pine Script®
10) Histogram Color Logic from Normality Result
The histogram color theme is selected from the Jarque Bera pass / fail result:
Teal palette when stats.is_normal is true
Red palette when stats.is_normal is false
This creates a direct link between statistical classification and visual presentation.
11) Gaussian Curve Overlay Calculation
The script defines a normal probability density function:
Pine Script®
For curve plotting:
It samples points across the histogram width
Maps each x position back to an MFI value from 0 to 100
Computes the PDF at that MFI value using the sample mean and standard deviation
Scales the PDF by the theoretical peak so the curve fits the histogram height
Key normalization idea:
Pine Script®
This makes the Gaussian curve visually comparable to the empirical histogram, even though one is a density and the other is raw frequency.
12) Dashboard Table Metrics
On the last bar, the script updates a table with the computed statistics:
Mean
StdDev
Skewness
Kurtosis
Jarque Bera statistic and normality classification
The result cell color changes based on normality:
Green for PASS (Normal)
Red for FAIL (Non Normal)
This gives traders a compact quantitative summary next to the visual distribution.
13) Overbought and Oversold Gradient Fills
The script adds gradient fills that appear when MFI moves beyond standard thresholds:
Pine Script®
This helps contextualize whether the current MFI reading is extreme while the histogram and dashboard describe the broader behavior of the recent MFI sample.
The indicator is designed for traders who want to understand how MFI behaves as a distribution, not only where it is on the current bar. It provides a compact statistical framework that helps answer questions such as:
Is MFI clustering around a narrow regime or spread across the full range
Is the recent MFI behavior skewed toward strong buying or selling pressure
Does the MFI sample look approximately normal, or is it fat tailed / asymmetric
How extreme is the current reading relative to the recent distribution
To support this, the script includes:
A live MFI line with dynamic gradient coloring
Overbought and oversold visual zones with gradient fills
A histogram of MFI frequency distribution over the selected lookback
An optional Gaussian curve overlay for visual comparison
A statistical dashboard with mean, standard deviation, skewness, kurtosis, and Jarque Bera normality test results
The histogram is drawn into the future area of the pane, so it does not interfere with the live MFI trace while still remaining visually aligned to the 0 to 100 oscillator scale.
Educational tool only. Not financial advice.
🔹 Features
🔸 1) Live MFI Oscillator with Regime Aware Coloring
The script plots a standard MFI line and colors it dynamically based on level behavior:
High MFI values transition toward red tones
Low MFI values transition toward green tones
Mid range values remain purple
This makes the oscillator easier to read at a glance, especially during sustained overbought or oversold conditions.
🔸 2) Overbought and Oversold Zone Visualization
The indicator includes standard MFI reference levels at 80 and 20, then adds gradient fills that become visible when the MFI pushes into extreme zones. This provides better visual emphasis for momentum extremes without cluttering the chart.
🔸 3) Rolling MFI History Collection for Statistical Analysis
The script maintains an internal array of the latest MFI values up to the user defined lookback length. This rolling sample is used to compute all distribution statistics and histogram frequencies on the last bar.
This design keeps the indicator responsive while ensuring the displayed distribution reflects the most recent market behavior.
🔸 4) Forward Projected MFI Distribution Histogram
A histogram is drawn in the oscillator pane using bins over the fixed MFI range from 0 to 100. Each bin counts how many MFI observations fall inside that interval during the lookback window.
The histogram is projected to the right of current price action in the pane, giving users a clean distribution panel without covering the live MFI line.
🔸 5) Configurable Histogram Resolution and Width
Users can control:
Lookback period used for distribution analysis
Number of histogram bins
Visual width of the histogram in future bars
This makes the tool flexible for both high level regime reading and finer distribution inspection.
🔸 6) Optional Gaussian Curve Overlay
When enabled, the script overlays a theoretical normal distribution curve using the sample mean and sample standard deviation. The curve is normalized to the histogram height so users can visually compare the empirical MFI distribution against a bell curve shape.
This is useful for quickly spotting asymmetry, multimodal clustering, or fat tail behavior.
🔸 7) Full Statistical Summary Dashboard
A built in dashboard table displays:
Mean
Standard Deviation
Skewness
Kurtosis (excess kurtosis)
Jarque Bera statistic
Pass / Fail normality status (95% threshold logic)
This turns the indicator into a compact quantitative diagnostic panel, not only a visual oscillator.
🔸 8) Jarque Bera Normality Test Classification
The script evaluates whether the MFI sample is approximately normal using a Jarque Bera style test and a fixed chi square threshold (95% confidence, 2 degrees of freedom). It then marks the result as PASS (Normal) or FAIL (Non Normal).
This helps traders distinguish between more stable oscillator regimes and structurally distorted ones.
🔸 9) Histogram Color Theme Based on Normality Result
The histogram automatically changes style depending on the test result:
Teal themed histogram when normality test passes
Red themed histogram when normality test fails
This creates an immediate visual signal of distribution quality without needing to read the dashboard first.
🔸 10) Last Bar Only Heavy Processing for Efficiency
Statistical calculations, histogram drawing, and dashboard refresh are performed only on the last bar. This reduces object churn and improves performance while preserving real time utility.
🔸 11) Object Based Drawing Management
The script uses custom types to organize logic:
DistributionStats for statistical values and normality output
HistoDrawer for histogram bars, curve lines, and labels
This makes the code structured and easier to extend with future features such as percentiles, z scores, or alternate tests.
🔹 Calculations
1) MFI Calculation
The script computes Money Flow Index from a user selected source and length:
This value is plotted in the oscillator pane and colored dynamically according to level.
2) Rolling History Buffer for Distribution Sampling
Each valid MFI value is pushed into a rolling array used for statistical analysis:
This ensures the sample size is capped at the selected lookback and continuously refreshed with recent values.
3) Sample Variance and Standard Deviation
The script computes sample variance using the classic n minus 1 denominator:
Standard deviation is then calculated as:
Using sample variance is appropriate here because the lookback window is treated as a sample of recent market behavior.
4) Sample Skewness Calculation
Skewness is computed from standardized deviations and corrected for sample size:
Interpretation:
Positive skew suggests more mass on lower values with a right tail toward high MFI prints
Negative skew suggests more mass on higher values with a left tail toward low MFI prints
5) Excess Kurtosis Calculation
The script calculates excess kurtosis, where a normal distribution is centered around 0:
Interpretation:
Positive excess kurtosis suggests heavier tails or more peaked behavior
Negative excess kurtosis suggests flatter distribution behavior
6) Jarque Bera Normality Test
The script uses skewness and excess kurtosis to compute the Jarque Bera statistic:
Then it compares the result against a 95 percent chi square critical value (2 degrees of freedom):
Important note:
The code defines a jb_p_value field in the stats type, but this version does not explicitly calculate or display a p value. The pass / fail logic is threshold based.
7) Fixed MFI Range Histogram Binning (0 to 100)
The histogram always bins data over the full MFI range:
Each MFI value is mapped to a bin index:
The index is clamped so values at boundaries stay valid:
This makes the histogram consistent across symbols and timeframes.
8) Frequency Counting and Peak Detection
For each binned MFI observation, the script increments a frequency counter and tracks the highest bin count:
The maximum frequency is later used to normalize histogram bar heights.
9) Histogram Rendering Geometry
The histogram is drawn as boxes in the oscillator pane, projected to the right of the last bar:
This effectively uses the MFI pane vertical range from about 10 to 90 for histogram height visualization, keeping it aligned with the oscillator scale.
Each bin is mapped to x coordinates using its MFI interval and the user selected histogram width:
Each frequency is mapped to a vertical height using:
10) Histogram Color Logic from Normality Result
The histogram color theme is selected from the Jarque Bera pass / fail result:
Teal palette when stats.is_normal is true
Red palette when stats.is_normal is false
This creates a direct link between statistical classification and visual presentation.
11) Gaussian Curve Overlay Calculation
The script defines a normal probability density function:
For curve plotting:
It samples points across the histogram width
Maps each x position back to an MFI value from 0 to 100
Computes the PDF at that MFI value using the sample mean and standard deviation
Scales the PDF by the theoretical peak so the curve fits the histogram height
Key normalization idea:
This makes the Gaussian curve visually comparable to the empirical histogram, even though one is a density and the other is raw frequency.
12) Dashboard Table Metrics
On the last bar, the script updates a table with the computed statistics:
Mean
StdDev
Skewness
Kurtosis
Jarque Bera statistic and normality classification
The result cell color changes based on normality:
Green for PASS (Normal)
Red for FAIL (Non Normal)
This gives traders a compact quantitative summary next to the visual distribution.
13) Overbought and Oversold Gradient Fills
The script adds gradient fills that appear when MFI moves beyond standard thresholds:
This helps contextualize whether the current MFI reading is extreme while the histogram and dashboard describe the broader behavior of the recent MFI sample.
Script de código abierto
Fiel al espíritu de TradingView, el creador de este script lo ha convertido en código abierto, para que los traders puedan revisar y verificar su funcionalidad. ¡Enhorabuena al autor! Aunque puede utilizarlo de forma gratuita, recuerde que cualquier republicación del código está sujeta a nuestras Normas internas.

Get exclusive indicators: pinescriptmarket.com
All content provided by UAlgo is for informational & educational purposes only. Past performance does not guarantee future results.
All content provided by UAlgo is for informational & educational purposes only. Past performance does not guarantee future results.
Exención de responsabilidad
La información y las publicaciones no constituyen, ni deben considerarse como, asesoramiento o recomendaciones financieras, de inversión, de trading u otro tipo, proporcionadas o respaldadas por TradingView. Obtenga más información en Condiciones de uso.
Script de código abierto
Fiel al espíritu de TradingView, el creador de este script lo ha convertido en código abierto, para que los traders puedan revisar y verificar su funcionalidad. ¡Enhorabuena al autor! Aunque puede utilizarlo de forma gratuita, recuerde que cualquier republicación del código está sujeta a nuestras Normas internas.
Get exclusive indicators: pinescriptmarket.com
All content provided by UAlgo is for informational & educational purposes only. Past performance does not guarantee future results.
All content provided by UAlgo is for informational & educational purposes only. Past performance does not guarantee future results.
Exención de responsabilidad
La información y las publicaciones no constituyen, ni deben considerarse como, asesoramiento o recomendaciones financieras, de inversión, de trading u otro tipo, proporcionadas o respaldadas por TradingView. Obtenga más información en Condiciones de uso.