OPEN-SOURCE SCRIPT
Actualizado Wyckoff Distribution Phase Map [AGPro Series]
Wyckoff Distribution Phase Map [AGPro Series]
🔹 OVERVIEW
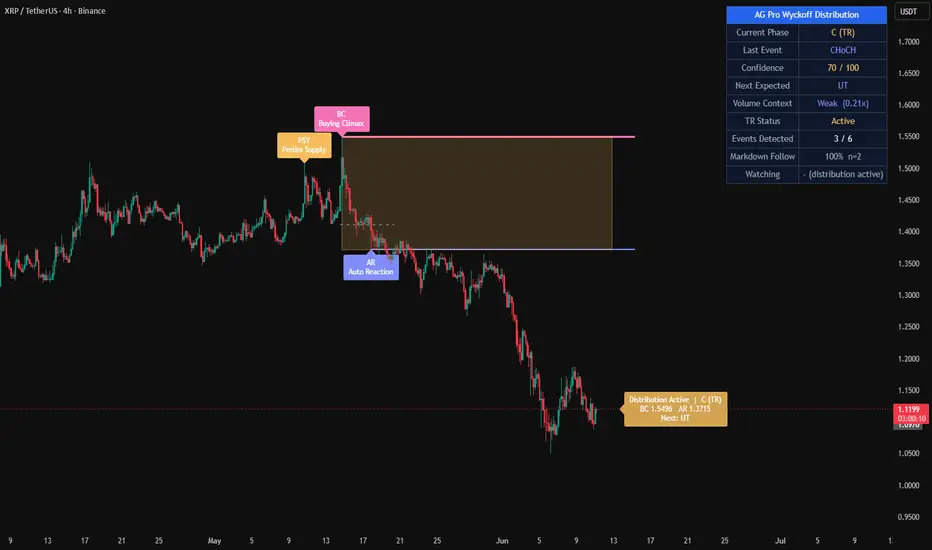
Wyckoff Distribution Phase Map is a retrospective structural mapping tool built on the classic Wyckoff distribution schematic. It locates and labels the six core distribution events — Preliminary Supply (PSY), Buying Climax (BC), Automatic Reaction (AR), Upthrust (UT), Sign of Weakness (SOW) and Last Point of Supply (LPSY) — only after a bearish Change of Character (CHoCH) confirms that the prior uptrend has structurally broken. The indicator frames the active trading range as a shaded zone, plots BC and AR horizontal references, and tracks the phase state (A, B, C, D, E) in a dedicated info panel with a forming-candidate watchlist before confirmation.
🔹 WHAT MAKES IT DIFFERENT
Most Wyckoff scripts on TradingView label events reactively on every elevated swing, producing dense, often contradictory signals during ranging or trending markets. This indicator takes the opposite approach. During an uptrend, the chart remains completely clean. Rolling trackers silently maintain candidate values for BC, PSY and AR in memory, while a live watchlist row in the panel shows the forming distribution candidate in real time. Events are only drawn on the chart after CHoCH locks the schematic, at which point PSY, BC and AR appear together as a confirmed retrospective bundle. UT, SOW and LPSY then populate as the post-CHoCH structure unfolds. A two-tier expiry system closes both incomplete and fully-played-out distributions, ensuring the active schematic on screen always reflects current market structure — not stale history.
🔹 METHODOLOGY
The engine runs in two coordinated layers. The first layer tracks higher-high and higher-low sequences to qualify an uptrend and rolls candidate values for the Buying Climax (running maximum swing high), Preliminary Supply (last pre-BC elevated swing high) and Automatic Reaction (running minimum after BC). The second layer watches for a structural break below the last confirmed higher-low, which defines the CHoCH. On CHoCH confirmation, the candidate values are snapshotted as BC, PSY and AR labels, the trading range zone is drawn, and the state machine advances to the forward-detection phase. Upthrust, Sign of Weakness and Last Point of Supply are then detected in strict sequence using a combination of price-to-BC, price-to-AR and volume-to-average filters. Volume context is computed against a 20-period moving average baseline with separate climactic, elevated and weak thresholds tuned for crypto and equities alike.
🔹 SIGNALS AND ALERTS
The indicator fires two categories of alerts. The CHoCH Confirmation alert triggers the moment the structural break locks in, including the resolved BC and AR levels. Event alerts fire for each subsequent UT, SOW and LPSY detection. No alert is fired during the forming phase — alerts are reserved for confirmed structural events, keeping notification noise low. A projected markdown line is drawn forward from LPSY using the trading range height as a symmetrical target, purely as a visual reference point rather than a trade signal.
🔹 KEY INPUTS
Core Engine inputs control swing lookback sensitivity, candidate maximum age and the post-CHoCH timeout window. Volume Analysis exposes the moving average length and three multipliers for climactic, elevated and weak volume classification. Visual inputs toggle the trading range zone, BC and AR horizontal levels, the CHoCH dashed break line, the markdown projection, the confidence halo and the floating distribution summary label, with full control over font size, line widths and zone transparency. The info panel can be repositioned to six anchor points and switched between dark and light themes. A Keep Historical Events toggle allows old schematics to remain on the chart after reset, off by default for a clean view.
🔹 HOW TO USE
Apply the indicator to any liquid instrument and any timeframe. During uptrends, observe the Watching row in the panel to monitor the forming BC candidate. When CHoCH prints, the full PSY, BC, AR bundle appears with the trading range shaded. From that point, use the Next Expected row to track what the engine is waiting for. The confidence score progresses from 70 at CHoCH to 97 at LPSY. The floating summary label on the right edge of the chart provides an at-a-glance status even when the primary event labels are scrolled off to the left. The indicator works standalone but is designed to complement any market structure, order flow or supply-and-demand workflow.
🔹 LIMITATIONS AND TRANSPARENCY
This tool is a pattern-recognition and labeling engine, not a strategy or trading signal generator. All events are detected retrospectively after their confirming bar has closed plus the swing lookback period — this is by design to eliminate redrawing. The Wyckoff schematic is a framework, not a deterministic forecast; not every distribution completes the full six-event sequence, and markets frequently fail schematics entirely and resume the prior trend. The volume analysis assumes reliable reported volume, so thin or fragmented markets may produce weaker classification. Confidence scores are internal heuristics tied to event progression, not statistical probabilities. Past schematic completions do not predict future market behavior.
🔹 RISK DISCLOSURE
This indicator is published for educational and analytical purposes only. It does not constitute financial advice, a trading recommendation or an investment solicitation. Trading any financial instrument involves substantial risk, including the potential loss of principal. Past performance does not guarantee future results. Users are solely responsible for their own trading decisions, risk management and independent research. Always backtest thoroughly and trade within a risk framework you understand.
🔹 OVERVIEW
Wyckoff Distribution Phase Map is a retrospective structural mapping tool built on the classic Wyckoff distribution schematic. It locates and labels the six core distribution events — Preliminary Supply (PSY), Buying Climax (BC), Automatic Reaction (AR), Upthrust (UT), Sign of Weakness (SOW) and Last Point of Supply (LPSY) — only after a bearish Change of Character (CHoCH) confirms that the prior uptrend has structurally broken. The indicator frames the active trading range as a shaded zone, plots BC and AR horizontal references, and tracks the phase state (A, B, C, D, E) in a dedicated info panel with a forming-candidate watchlist before confirmation.
🔹 WHAT MAKES IT DIFFERENT
Most Wyckoff scripts on TradingView label events reactively on every elevated swing, producing dense, often contradictory signals during ranging or trending markets. This indicator takes the opposite approach. During an uptrend, the chart remains completely clean. Rolling trackers silently maintain candidate values for BC, PSY and AR in memory, while a live watchlist row in the panel shows the forming distribution candidate in real time. Events are only drawn on the chart after CHoCH locks the schematic, at which point PSY, BC and AR appear together as a confirmed retrospective bundle. UT, SOW and LPSY then populate as the post-CHoCH structure unfolds. A two-tier expiry system closes both incomplete and fully-played-out distributions, ensuring the active schematic on screen always reflects current market structure — not stale history.
🔹 METHODOLOGY
The engine runs in two coordinated layers. The first layer tracks higher-high and higher-low sequences to qualify an uptrend and rolls candidate values for the Buying Climax (running maximum swing high), Preliminary Supply (last pre-BC elevated swing high) and Automatic Reaction (running minimum after BC). The second layer watches for a structural break below the last confirmed higher-low, which defines the CHoCH. On CHoCH confirmation, the candidate values are snapshotted as BC, PSY and AR labels, the trading range zone is drawn, and the state machine advances to the forward-detection phase. Upthrust, Sign of Weakness and Last Point of Supply are then detected in strict sequence using a combination of price-to-BC, price-to-AR and volume-to-average filters. Volume context is computed against a 20-period moving average baseline with separate climactic, elevated and weak thresholds tuned for crypto and equities alike.
🔹 SIGNALS AND ALERTS
The indicator fires two categories of alerts. The CHoCH Confirmation alert triggers the moment the structural break locks in, including the resolved BC and AR levels. Event alerts fire for each subsequent UT, SOW and LPSY detection. No alert is fired during the forming phase — alerts are reserved for confirmed structural events, keeping notification noise low. A projected markdown line is drawn forward from LPSY using the trading range height as a symmetrical target, purely as a visual reference point rather than a trade signal.
🔹 KEY INPUTS
Core Engine inputs control swing lookback sensitivity, candidate maximum age and the post-CHoCH timeout window. Volume Analysis exposes the moving average length and three multipliers for climactic, elevated and weak volume classification. Visual inputs toggle the trading range zone, BC and AR horizontal levels, the CHoCH dashed break line, the markdown projection, the confidence halo and the floating distribution summary label, with full control over font size, line widths and zone transparency. The info panel can be repositioned to six anchor points and switched between dark and light themes. A Keep Historical Events toggle allows old schematics to remain on the chart after reset, off by default for a clean view.
🔹 HOW TO USE
Apply the indicator to any liquid instrument and any timeframe. During uptrends, observe the Watching row in the panel to monitor the forming BC candidate. When CHoCH prints, the full PSY, BC, AR bundle appears with the trading range shaded. From that point, use the Next Expected row to track what the engine is waiting for. The confidence score progresses from 70 at CHoCH to 97 at LPSY. The floating summary label on the right edge of the chart provides an at-a-glance status even when the primary event labels are scrolled off to the left. The indicator works standalone but is designed to complement any market structure, order flow or supply-and-demand workflow.
🔹 LIMITATIONS AND TRANSPARENCY
This tool is a pattern-recognition and labeling engine, not a strategy or trading signal generator. All events are detected retrospectively after their confirming bar has closed plus the swing lookback period — this is by design to eliminate redrawing. The Wyckoff schematic is a framework, not a deterministic forecast; not every distribution completes the full six-event sequence, and markets frequently fail schematics entirely and resume the prior trend. The volume analysis assumes reliable reported volume, so thin or fragmented markets may produce weaker classification. Confidence scores are internal heuristics tied to event progression, not statistical probabilities. Past schematic completions do not predict future market behavior.
🔹 RISK DISCLOSURE
This indicator is published for educational and analytical purposes only. It does not constitute financial advice, a trading recommendation or an investment solicitation. Trading any financial instrument involves substantial risk, including the potential loss of principal. Past performance does not guarantee future results. Users are solely responsible for their own trading decisions, risk management and independent research. Always backtest thoroughly and trade within a risk framework you understand.
Notas de prensa
UPDATE NOTES - v2.4This update focuses on measurement and presentation quality.
The core purpose of the script remains unchanged.
This release adds a measured follow-rate layer for the markdown
projection and cleans up the panel's text rendering, without touching
how any Wyckoff event is detected.
This script continues to function as an analytical and visualization tool.
It does not attempt to predict price direction or provide guaranteed outcomes.
------------------------
What Changed
------------------------
- A Markdown Follow layer was added to the panel. Every confirmed LPSY
on the current chart is tracked once against the same target the
projection line draws (the AR level minus the trading-range height).
It counts as followed when price reaches that target before reclaiming
the BC level, and as failed when BC is reclaimed first or the tracking
window times out. The panel reports the follow rate with its sample
size (for example 62% n=13) and stays neutral until at least 8
resolved distributions exist, so small samples are never presented as
evidence. The Confidence ladder still describes how complete the
schematic is; the new row shows how such schematics actually resolved
on this chart.
- The tracker keeps its own frozen copies of the BC and target levels,
so a distribution reset never disturbs an open measurement.
- Volume context handling was hardened for symbols that do not provide
volume data, so the panel no longer renders an undefined ratio on
those instruments.
- All internal branching helpers were restructured for stricter Pine
v6 style compliance, with identical outputs.
------------------------
Visual Improvements
------------------------
- The Keep Historical Events setting now also applies to event labels.
Previously a reset removed the zone and level lines but left old PSY,
BC, AR, UT, SOW, and LPSY labels on the chart permanently, which could
leave orphaned markers from long-expired distributions. With the
setting off (the default), a reset now clears the labels of the closed
distribution as well.
- The PSY label is skipped when its pivot sits within one swing length
of the Buying Climax bar. At that distance the two labels stacked on
top of each other and PSY added no separate visual information.
- Event labels gained a Descriptive style (now the default): each
label shows the classic Wyckoff code with the full event name on a
second line (for example BC / Buying Climax), and every label carries
a one-sentence explanatory tooltip on hover. A Compact option keeps
the classic short codes for traders who prefer them.
- All panel and label text now uses plain characters for consistent
rendering across platforms, fonts, and themes, including the
high-confidence halo marker.
- The panel gained one row while keeping the same width, alignment,
and AGPro surface, so the information flow remains balanced.
------------------------
Interface & Usability
------------------------
- Alert messages were normalized to the same plain-character style.
- Default visual settings, label behavior, zone drawing, and the
Live Watchlist behave exactly as before.
------------------------
Behavior Notes
------------------------
This update does not change how PSY, BC, AR, CHoCH, UT, SOW, or LPSY
are detected, nor how the trading range, levels, or projection are
drawn.
The goal is to back the projection with measured history, not to
introduce new predictive behavior.
------------------------
Limitations Reminder
------------------------
The script remains a rule-based analytical tool.
The follow rate is measured on the current chart and timeframe only.
Complete distribution schematics are rare events, so the sample size
can stay small on shorter histories; the row remains neutral until
enough resolved cases exist.
Market conditions such as volatility, liquidity, and timeframe
differences may affect how events appear.
------------------------
Risk Reminder
------------------------
This script is for educational and analytical purposes only.
It does not provide financial advice or guaranteed trading outcomes.
Users remain responsible for their own decisions.
Script de código abierto
Fiel al espíritu de TradingView, el creador de este script lo ha convertido en código abierto, para que los traders puedan revisar y verificar su funcionalidad. ¡Enhorabuena al autor! Aunque puede utilizarlo de forma gratuita, recuerde que cualquier republicación del código está sujeta a nuestras Normas internas.

🧠 Trading Suite - Flagship Workflow
tradingview.com/script/XJmX3p98-Trading-Suite-AGPro-Series/
🔷 Crypto Setup Planner - Multi-Symbol Planner
tradingview.com/script/LgVRo7Ql-Crypto-Setup-Planner-AGPro-Series/
tradingview.com/script/XJmX3p98-Trading-Suite-AGPro-Series/
🔷 Crypto Setup Planner - Multi-Symbol Planner
tradingview.com/script/LgVRo7Ql-Crypto-Setup-Planner-AGPro-Series/
Exención de responsabilidad
La información y las publicaciones no constituyen, ni deben considerarse como, asesoramiento o recomendaciones financieras, de inversión, de trading u otro tipo, proporcionadas o respaldadas por TradingView. Obtenga más información en Condiciones de uso.
Script de código abierto
Fiel al espíritu de TradingView, el creador de este script lo ha convertido en código abierto, para que los traders puedan revisar y verificar su funcionalidad. ¡Enhorabuena al autor! Aunque puede utilizarlo de forma gratuita, recuerde que cualquier republicación del código está sujeta a nuestras Normas internas.
🧠 Trading Suite - Flagship Workflow
tradingview.com/script/XJmX3p98-Trading-Suite-AGPro-Series/
🔷 Crypto Setup Planner - Multi-Symbol Planner
tradingview.com/script/LgVRo7Ql-Crypto-Setup-Planner-AGPro-Series/
tradingview.com/script/XJmX3p98-Trading-Suite-AGPro-Series/
🔷 Crypto Setup Planner - Multi-Symbol Planner
tradingview.com/script/LgVRo7Ql-Crypto-Setup-Planner-AGPro-Series/
Exención de responsabilidad
La información y las publicaciones no constituyen, ni deben considerarse como, asesoramiento o recomendaciones financieras, de inversión, de trading u otro tipo, proporcionadas o respaldadas por TradingView. Obtenga más información en Condiciones de uso.