EMA 9/21/50 Band
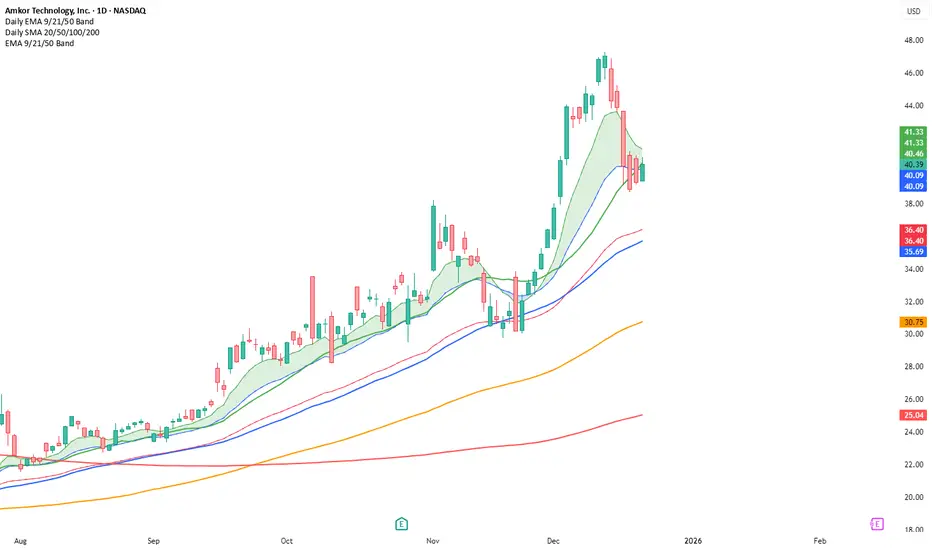
EMA band indicator plotting the 9, 21, and 50 exponential moving averages based on the **active chart timeframe**. Designed to adapt dynamically as you change timeframes, helping visualize short-term momentum, trend alignment, and dynamic support and resistance. Useful for identifying trend strength, pullbacks, and momentum shifts without anchoring to a fixed higher timeframe.

Exención de responsabilidad
La información y las publicaciones no constituyen, ni deben considerarse como, asesoramiento o recomendaciones financieras, de inversión, de trading u otro tipo, proporcionadas o respaldadas por TradingView. Obtenga más información en Condiciones de uso.
Exención de responsabilidad
La información y las publicaciones no constituyen, ni deben considerarse como, asesoramiento o recomendaciones financieras, de inversión, de trading u otro tipo, proporcionadas o respaldadas por TradingView. Obtenga más información en Condiciones de uso.