Bull/Bear Band Signals
Bull/Bear Band Signals
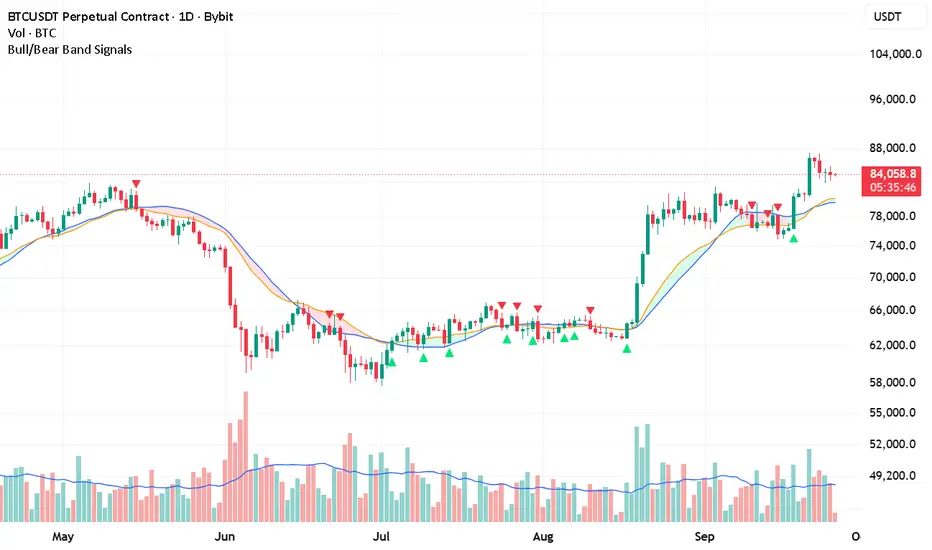
Bull/Bear Band Signals is an adaptation of the Bull Market Support Band concept, combining a Simple Moving Average (SMA) and an Exponential Moving Average (EMA) into a band that shows where price sits relative to both averages.
The classic Bull Market Support Band uses a 20-week SMA and a 21-week EMA. This indicator calculates its averages on the current chart timeframe and offers several length presets. With the Position preset on a weekly chart and Close selected as the source, it uses the classic 20-week SMA / 21-week EMA combination.
The underlying moving-average concept is established. This implementation focuses on confirmed-bar signals, configurable visuals, and alerts for transitions outside and back inside the band.

Reading the band
The SMA is blue and the EMA is orange by default. Their colors remain distinct when they cross and can be customized independently.
The higher average defines the upper boundary, and the lower average defines the lower boundary. The fill turns green when the selected source finishes above both averages and red when it finishes below both.
Inside the band, the fill retains its last directional color by default. An optional neutral mode changes it to gray. A green or red fill therefore does not necessarily mean the source is currently outside the band.
Close is the default source. Other built-in OHLC sources are available and, when selected, are used for both the averages and signal conditions.
Signals
• Bull Reclaim: a small green triangle appears when the selected source finishes above the band after the previous bar was not above it.
• Bear Breakdown: a small red triangle appears when the selected source finishes below the band after the previous bar was not below it.
• SMA/EMA Cross: a small dot marks a confirmed crossing of the averages. It is a separate visual event and does not trigger or filter the directional triangles.
The triangles identify transitions, not guaranteed entries. Another signal in the same direction can appear after a return into the band followed by a new exit.

Retest and inside-band alerts
Retest Bull identifies a return into the band from above. Retest Bear identifies a return from below. These events describe re-entry only; they do not confirm that support or resistance has held.
Generic inside-band alerts can be disabled, triggered on entry, or triggered on every confirmed bar inside the band. When an enabled retest alert applies, it takes priority over the generic inside-band alert.
Presets
• Scalp — SMA 20 / EMA 21
• Intraday — SMA 50 / EMA 55
• Swing — SMA 100 / EMA 110
• Position — SMA 20 / EMA 21
Auto selects Scalp for seconds-based charts and minute charts up to 15 minutes, Intraday for minute charts above 15 and up to 60 minutes, and Swing for intraday charts above 60 minutes and up to 12 hours. Other supported timeframes use Position.
All lengths refer to bars on the current chart. These are convenient parameter presets, not settings claimed to be optimal for every market.

Confirmed-bar behavior
Signals, alerts, band values, and regime colors update only when the chart candle closes. During an open candle, the band retains its last confirmed values.
The script does not use future data, external indicator sources, or multi-timeframe requests. It does not backdate signals, and it uses plotted markers rather than deleting older signals through a label-retention limit.
This prevents provisional intrabar signals from appearing and disappearing as the current candle changes. The trade-off is that a signal becomes available only at the close, not at the first intrabar crossing.
Historical results remain dependent on the selected settings and available input data. Provider corrections, changes in loaded history, or changes to the symbol and timeframe can produce different calculations. Synthetic chart types are disabled.
Alerts and customization
The indicator provides individual event alerts and optional JSON messages for webhook integrations. Select “Any alert() function call” to use the JSON route. It sends at most one selected event per confirmed bar per alert instance.
Band transparency, edge colors, line width, signal visibility, and marker spacing can be adjusted. ATR is used only to position the directional markers away from the candles; it does not determine band width or filter signals.
Visual settings and alert settings are independent. Hiding a triangle does not disable its corresponding alert.
Limitations
Like other moving-average tools, the indicator reacts to price and can lag fast moves. Sideways conditions can generate frequent opposing signals. There are no volume, trend-strength, or market-structure filters.
The script is an indicator, not a trading strategy. It does not manage positions, define exits, or provide a backtested performance claim. Its purpose is to make band transitions visible and consistently report them at bar close.
For informational and educational purposes only. Signals may be incorrect and do not constitute financial or investment advice. Trading involves substantial risk, and users remain responsible for their decisions and risk management.
Bull/Bear Band Signals is an adaptation of the Bull Market Support Band concept, combining a Simple Moving Average (SMA) and an Exponential Moving Average (EMA) into a band that shows where price sits relative to both averages.
The classic Bull Market Support Band uses a 20-week SMA and a 21-week EMA. This indicator calculates its averages on the current chart timeframe and offers several length presets. With the Position preset on a weekly chart and Close selected as the source, it uses the classic 20-week SMA / 21-week EMA combination.
The underlying moving-average concept is established. This implementation focuses on confirmed-bar signals, configurable visuals, and alerts for transitions outside and back inside the band.
Reading the band
The SMA is blue and the EMA is orange by default. Their colors remain distinct when they cross and can be customized independently.
The higher average defines the upper boundary, and the lower average defines the lower boundary. The fill turns green when the selected source finishes above both averages and red when it finishes below both.
Inside the band, the fill retains its last directional color by default. An optional neutral mode changes it to gray. A green or red fill therefore does not necessarily mean the source is currently outside the band.
Close is the default source. Other built-in OHLC sources are available and, when selected, are used for both the averages and signal conditions.
Signals
• Bull Reclaim: a small green triangle appears when the selected source finishes above the band after the previous bar was not above it.
• Bear Breakdown: a small red triangle appears when the selected source finishes below the band after the previous bar was not below it.
• SMA/EMA Cross: a small dot marks a confirmed crossing of the averages. It is a separate visual event and does not trigger or filter the directional triangles.
The triangles identify transitions, not guaranteed entries. Another signal in the same direction can appear after a return into the band followed by a new exit.
Retest and inside-band alerts
Retest Bull identifies a return into the band from above. Retest Bear identifies a return from below. These events describe re-entry only; they do not confirm that support or resistance has held.
Generic inside-band alerts can be disabled, triggered on entry, or triggered on every confirmed bar inside the band. When an enabled retest alert applies, it takes priority over the generic inside-band alert.
Presets
• Scalp — SMA 20 / EMA 21
• Intraday — SMA 50 / EMA 55
• Swing — SMA 100 / EMA 110
• Position — SMA 20 / EMA 21
Auto selects Scalp for seconds-based charts and minute charts up to 15 minutes, Intraday for minute charts above 15 and up to 60 minutes, and Swing for intraday charts above 60 minutes and up to 12 hours. Other supported timeframes use Position.
All lengths refer to bars on the current chart. These are convenient parameter presets, not settings claimed to be optimal for every market.
Confirmed-bar behavior
Signals, alerts, band values, and regime colors update only when the chart candle closes. During an open candle, the band retains its last confirmed values.
The script does not use future data, external indicator sources, or multi-timeframe requests. It does not backdate signals, and it uses plotted markers rather than deleting older signals through a label-retention limit.
This prevents provisional intrabar signals from appearing and disappearing as the current candle changes. The trade-off is that a signal becomes available only at the close, not at the first intrabar crossing.
Historical results remain dependent on the selected settings and available input data. Provider corrections, changes in loaded history, or changes to the symbol and timeframe can produce different calculations. Synthetic chart types are disabled.
Alerts and customization
The indicator provides individual event alerts and optional JSON messages for webhook integrations. Select “Any alert() function call” to use the JSON route. It sends at most one selected event per confirmed bar per alert instance.
Band transparency, edge colors, line width, signal visibility, and marker spacing can be adjusted. ATR is used only to position the directional markers away from the candles; it does not determine band width or filter signals.
Visual settings and alert settings are independent. Hiding a triangle does not disable its corresponding alert.
Limitations
Like other moving-average tools, the indicator reacts to price and can lag fast moves. Sideways conditions can generate frequent opposing signals. There are no volume, trend-strength, or market-structure filters.
The script is an indicator, not a trading strategy. It does not manage positions, define exits, or provide a backtested performance claim. Its purpose is to make band transitions visible and consistently report them at bar close.
For informational and educational purposes only. Signals may be incorrect and do not constitute financial or investment advice. Trading involves substantial risk, and users remain responsible for their decisions and risk management.

Exención de responsabilidad
La información y las publicaciones no constituyen, ni deben considerarse como, asesoramiento o recomendaciones financieras, de inversión, de trading u otro tipo, proporcionadas o respaldadas por TradingView. Obtenga más información en Condiciones de uso.
Exención de responsabilidad
La información y las publicaciones no constituyen, ni deben considerarse como, asesoramiento o recomendaciones financieras, de inversión, de trading u otro tipo, proporcionadas o respaldadas por TradingView. Obtenga más información en Condiciones de uso.