Actualizado
Nwog - Ndog Tracker (M1D)
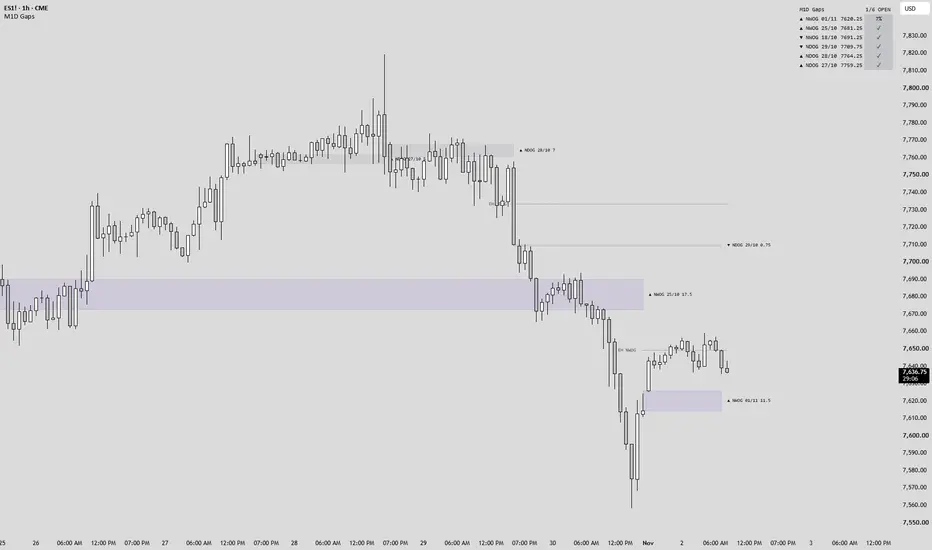
NWOG - NDOG Tracker (M1D)
Maps the two electronic-session opening gaps on index futures and tracks how much of each one price has traded back through.
A New Day Opening Gap is the distance between the prior session's 17:00 close and the 18:00 Globex reopen — the CME maintenance halt. A New Week Opening Gap is the distance between Friday's 16:59 close and the Sunday 18:00 reopen. These are electronic-session boundaries and are deliberately not the 09:30 cash open or the 16:14 regular-hours close, which belong to a different gap entirely.
How It Is Built-
No bar prints inside either window, so the bar immediately preceding a reopen always carries the true prior close. Both gaps read their origin from that bar rather than from a bar found by its clock time, which is what keeps them correct through a holiday or an early close — on those days the scheduled closing bar never prints at all, and a tool that waits for it builds the gap off a stale price.
A gap is read from the side its reopen landed on. Opening above the prior close leaves the unfilled area below price, where it stands as support. Opening below leaves it overhead as resistance.
Every boundary is detected on the bar that contains its target time rather than by comparing bar-open times, so each one resolves correctly on any intraday timeframe. All detection runs on confirmed bars only.
What It Draws-
Each gap is a box spanning from its origin to its right edge, captioned with its direction, type and date. The caption sits level with the consequent encroachment just past the right edge, and holds the same visual distance from the box at any zoom.
Direction and type are carried separately so neither has to be inferred from the other. The box fill stays keyed to the type, daily and weekly each keeping their own wash, while the border and the caption arrow carry the polarity.
Levels inside a gap are optional. Quadrants draw 0.25, the consequent encroachment and 0.75. Octants draw eighths. Each level's value is printed beside the right end of its own line, level with it at any zoom, and the consequent encroachment is named CE and carries its own colour. The gap high and low are the box itself and are not redrawn as levels.
A table lists the tracked gaps newest first, each with its direction and the percentage of it that price has covered, and a count of how many remain unfilled. The callout arrow in the example chart points from a gap to this table so the two can be matched up at a glance.

Settings-
Gap times, session close, and the reopen times are each adjustable and independent of one another.
Extend controls how far a box runs. Until next gap keeps only the newest box tracking price, clipping the previous one as a new gap forms. Extend to price runs every kept box to the current bar. End of day stops each at the session close. The weekly gap adds End of week, which stops it at Friday's close and keeps it visible for a set number of weeks afterwards.
Direction colouring can be switched off, in which case every border and caption falls back to the single border colour. The two direction colours themselves are adjustable.
Keep-last counts, fill and border colours, label size, and the table position and length are all adjustable.
Notes-
Fill percentage is the share of a gap's own range that price has covered, measured between the deepest and shallowest points reached inside it. It only increases, and reaches 100 percent once price has covered the gap end to end. It is deliberately direction-agnostic: it records how much of the gap has been consumed, not which side consumed it.
Being traded through does not remove a gap. A filled gap stays on the chart, and only the keep-last count clears it.
Disclaimer-
This script reports where these gaps sit and how much of each has been consumed. It does not generate signals and it is not financial advice.
Maps the two electronic-session opening gaps on index futures and tracks how much of each one price has traded back through.
A New Day Opening Gap is the distance between the prior session's 17:00 close and the 18:00 Globex reopen — the CME maintenance halt. A New Week Opening Gap is the distance between Friday's 16:59 close and the Sunday 18:00 reopen. These are electronic-session boundaries and are deliberately not the 09:30 cash open or the 16:14 regular-hours close, which belong to a different gap entirely.
How It Is Built-
No bar prints inside either window, so the bar immediately preceding a reopen always carries the true prior close. Both gaps read their origin from that bar rather than from a bar found by its clock time, which is what keeps them correct through a holiday or an early close — on those days the scheduled closing bar never prints at all, and a tool that waits for it builds the gap off a stale price.
A gap is read from the side its reopen landed on. Opening above the prior close leaves the unfilled area below price, where it stands as support. Opening below leaves it overhead as resistance.
Every boundary is detected on the bar that contains its target time rather than by comparing bar-open times, so each one resolves correctly on any intraday timeframe. All detection runs on confirmed bars only.
What It Draws-
Each gap is a box spanning from its origin to its right edge, captioned with its direction, type and date. The caption sits level with the consequent encroachment just past the right edge, and holds the same visual distance from the box at any zoom.
Direction and type are carried separately so neither has to be inferred from the other. The box fill stays keyed to the type, daily and weekly each keeping their own wash, while the border and the caption arrow carry the polarity.
Levels inside a gap are optional. Quadrants draw 0.25, the consequent encroachment and 0.75. Octants draw eighths. Each level's value is printed beside the right end of its own line, level with it at any zoom, and the consequent encroachment is named CE and carries its own colour. The gap high and low are the box itself and are not redrawn as levels.
A table lists the tracked gaps newest first, each with its direction and the percentage of it that price has covered, and a count of how many remain unfilled. The callout arrow in the example chart points from a gap to this table so the two can be matched up at a glance.
Settings-
Gap times, session close, and the reopen times are each adjustable and independent of one another.
Extend controls how far a box runs. Until next gap keeps only the newest box tracking price, clipping the previous one as a new gap forms. Extend to price runs every kept box to the current bar. End of day stops each at the session close. The weekly gap adds End of week, which stops it at Friday's close and keeps it visible for a set number of weeks afterwards.
Direction colouring can be switched off, in which case every border and caption falls back to the single border colour. The two direction colours themselves are adjustable.
Keep-last counts, fill and border colours, label size, and the table position and length are all adjustable.
Notes-
Fill percentage is the share of a gap's own range that price has covered, measured between the deepest and shallowest points reached inside it. It only increases, and reaches 100 percent once price has covered the gap end to end. It is deliberately direction-agnostic: it records how much of the gap has been consumed, not which side consumed it.
Being traded through does not remove a gap. A filled gap stays on the chart, and only the keep-last count clears it.
Disclaimer-
This script reports where these gaps sit and how much of each has been consumed. It does not generate signals and it is not financial advice.
Notas de prensa
WHATS NEW The caption is now yours to place, the levels can be just the CE, and a stack of levels can no longer render as a solid dark block.
- Caption placement — a new Visuals input parks the gap's name anywhere around its box: left of the zone at the gap's origin (the new default, so the name marks where the gap formed), riding the trailing right edge as before, or above/below the start. Each side offers top, middle and bottom.
- CE only — the Levels input gains a mode that draws just the consequent encroachment, the 50% of the gap, with no quadrant or octant lines around it.
- Level style — a new input (Dotted / Solid / Dashed, dotted by default) for the quadrant and octant lines. Solid internal lines stacked inside a narrow gap could merge into one dark block once the chart was zoomed to where the gap spans only a few pixels; dotted lines read as a grid at any zoom. Pick Solid for the old look if that trade suits you.
- CE style — the consequent encroachment gets its own style input, solid by default, so the 50% reads senior to the dotted levels around it.
- A right-edge caption now carries its spacing gap only when level labels are actually printed beside it — otherwise the name sits tight to its box.
Existing charts keep their saved settings — reset the indicator to defaults to pick up the new caption position.
Notas de prensa
The Event Horizon. Where two gaps of the same family sit on the chart with clear air between them, the 50% of that space is now drawn. It is measured between the two FACING edges — the lower edge of the upper gap to the upper edge of the lower one — which makes it a level of the PAIR. It is not a level inside either gap: the 50% of a single gap is the consequent encroachment, which this script already draws and which is unchanged.
It cannot exist without its pair. The horizons are rebuilt from the gap store whenever a gap arrives or retires, so a line can never outlive either of the two gaps that justify it. Two gaps of a family have to be on the chart before there is anything to measure — raise the retention inputs if you want more of them.
Overlapping gaps get none. Two gaps that overlap enclose no space, so there is no equilibrium between them to draw, and a number produced anyway would mean nothing.
Direction is read from colour.
The newer gap sitting above the older one draws in the stepping-up colour, below it in stepping-down — the same scheme the gap borders already use.
Style inputs.
Dotted by default or dashed, width 1 to 3, both colours, and an optional short E.H tag at the left end of the line naming the family it belongs to. Left, because the right edge already carries the trailing captions and the level values.
Anchoring. Each line is drawn from the newer gap's own origin bar — the first candle on which both gaps existed and the level could actually be known — and extends to the live edge.
Two new alerts.
NDOG Event Horizon traded and NWOG Event Horizon traded, firing when price crosses the horizon between that family's two newest gaps.
Nothing else changed. The gap boxes, consequent encroachment, quadrants and octants are untouched. Existing charts keep their saved settings; the Event Horizon is on by default on a fresh add.
Notas de prensa
Fixed: no stray dot with the table offWith "Show table" turned off, a small dot stayed on the chart where the table used to be. The table is now only created while it is switched on, so turning it off leaves nothing behind. Gaps, levels, fill percentages and alerts are unchanged.
Notas de prensa
Clean lookGaps are borderless fills: grey for NDOG, faint violet for NWOG. Direction shows as the ▲ / ▼ on the name. CE, levels and Event Horizon are dotted grey lines, and colours flip on a dark chart.
Labels setting
Labels sit past the right edge, left of the start, inside the box's top-left corner, or Off. Off hides every gap name, level label and Event Horizon tag at once. Labels are tiny by default (9 pt) with a size setting. Date and size can be added to the names, prices are in the tooltip.
New table
Borderless, three columns. The title row shows how many gaps are still open. Each gap shows its name, CE price and fill %, with a tick once fully filled. Hover a row for the edges, size and traded range.
Event Horizon pairs gaps by price
A Event Horizon is now drawn only between two gaps of the same type that sit next to each other in price, with no other gap in the space between them. Lines no longer stack across other gaps. It is off by default; turn it on under Event Horizon.
Settings reset
Several colour and style settings were removed, so saved settings for this script reset to the new defaults after updating.

Exención de responsabilidad
La información y las publicaciones no constituyen, ni deben considerarse como, asesoramiento o recomendaciones financieras, de inversión, de trading u otro tipo, proporcionadas o respaldadas por TradingView. Obtenga más información en Condiciones de uso.
Exención de responsabilidad
La información y las publicaciones no constituyen, ni deben considerarse como, asesoramiento o recomendaciones financieras, de inversión, de trading u otro tipo, proporcionadas o respaldadas por TradingView. Obtenga más información en Condiciones de uso.