Actualizado
[blackcat] L1 Stick-Line Merged MACD
Level: 1
Background
The MACD is a superior derivative of moving average crossovers and was developed by Gerald Appel in 1979 as a market timing tool. MACD uses two exponential moving averages with different bar periods, which are then subtracted to form what Mr. Appel calls the Fast Line. A 9-period moving average of the fast line creates the slow line.
Function
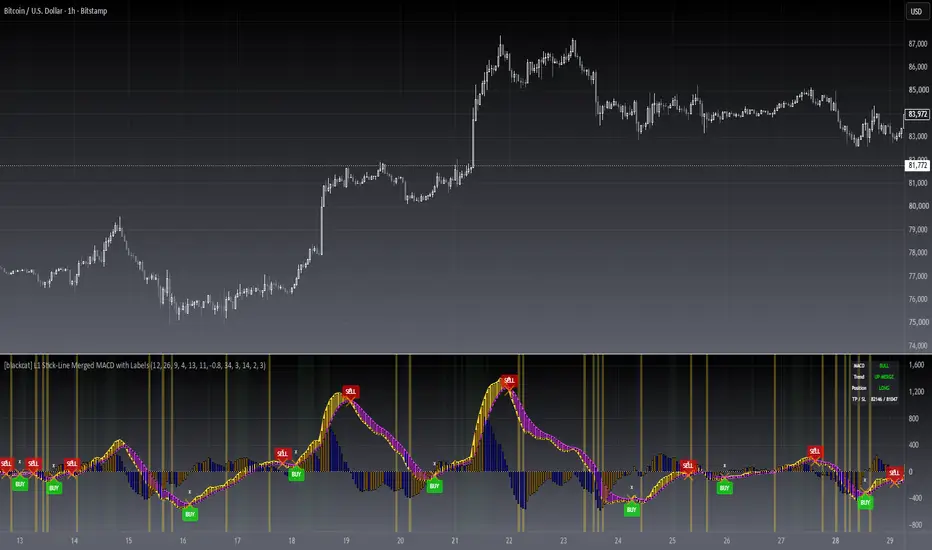
[blackcat] L1 Stick-Line Merged MACD merges dif and dea lines with macd sticks by the same color candles. The generation of candles help to confirm the trend contiuation. E.g. yellow candles indicate up trend continuation while blue candles indicate down trend continuation
Key Signal
dif --> classic MACD diff fast line in yellow
dea --> classic MACD dea slow line in fuchsia
macd --> classic difference histogram
upslmerge --> up trend continuation yellow candle merge condition
dnslmerge --> down trend continuation blue candle merge condition
Pros and Cons
Pros:
1. merged line and stick with candles help confirm trend reversal
2. long entry signal is indicated.
Cons:
1. need sophisticated knowledge of MACD to use this well
2. this still requires a lot of MACD experience to obtain reliable trading signals
Remarks
Merge lines and sticks of MACD into candles. Better view of the trend
Readme
In real life, I am a prolific inventor. I have successfully applied for more than 60 international and regional patents in the past 12 years. But in the past two years or so, I have tried to transfer my creativity to the development of trading strategies. Tradingview is the ideal platform for me. I am selecting and contributing some of the hundreds of scripts to publish in Tradingview community. Welcome everyone to interact with me to discuss these interesting pine scripts.
The scripts posted are categorized into 5 levels according to my efforts or manhours put into these works.
Level 1 : interesting script snippets or distinctive improvement from classic indicators or strategy. Level 1 scripts can usually appear in more complex indicators as a function module or element.
Level 2 : composite indicator/strategy. By selecting or combining several independent or dependent functions or sub indicators in proper way, the composite script exhibits a resonance phenomenon which can filter out noise or fake trading signal to enhance trading confidence level.
Level 3 : comprehensive indicator/strategy. They are simple trading systems based on my strategies. They are commonly containing several or all of entry signal, close signal, stop loss, take profit, re-entry, risk management, and position sizing techniques. Even some interesting fundamental and mass psychological aspects are incorporated.
Level 4 : script snippets or functions that do not disclose source code. Interesting element that can reveal market laws and work as raw material for indicators and strategies. If you find Level 1~2 scripts are helpful, Level 4 is a private version that took me far more efforts to develop.
Level 5 : indicator/strategy that do not disclose source code. private version of Level 3 script with my accumulated script processing skills or a large number of custom functions. I had a private function library built in past two years. Level 5 scripts use many of them to achieve private trading strategy.
Background
The MACD is a superior derivative of moving average crossovers and was developed by Gerald Appel in 1979 as a market timing tool. MACD uses two exponential moving averages with different bar periods, which are then subtracted to form what Mr. Appel calls the Fast Line. A 9-period moving average of the fast line creates the slow line.
Function
[blackcat] L1 Stick-Line Merged MACD merges dif and dea lines with macd sticks by the same color candles. The generation of candles help to confirm the trend contiuation. E.g. yellow candles indicate up trend continuation while blue candles indicate down trend continuation
Key Signal
dif --> classic MACD diff fast line in yellow
dea --> classic MACD dea slow line in fuchsia
macd --> classic difference histogram
upslmerge --> up trend continuation yellow candle merge condition
dnslmerge --> down trend continuation blue candle merge condition
Pros and Cons
Pros:
1. merged line and stick with candles help confirm trend reversal
2. long entry signal is indicated.
Cons:
1. need sophisticated knowledge of MACD to use this well
2. this still requires a lot of MACD experience to obtain reliable trading signals
Remarks
Merge lines and sticks of MACD into candles. Better view of the trend
Readme
In real life, I am a prolific inventor. I have successfully applied for more than 60 international and regional patents in the past 12 years. But in the past two years or so, I have tried to transfer my creativity to the development of trading strategies. Tradingview is the ideal platform for me. I am selecting and contributing some of the hundreds of scripts to publish in Tradingview community. Welcome everyone to interact with me to discuss these interesting pine scripts.
The scripts posted are categorized into 5 levels according to my efforts or manhours put into these works.
Level 1 : interesting script snippets or distinctive improvement from classic indicators or strategy. Level 1 scripts can usually appear in more complex indicators as a function module or element.
Level 2 : composite indicator/strategy. By selecting or combining several independent or dependent functions or sub indicators in proper way, the composite script exhibits a resonance phenomenon which can filter out noise or fake trading signal to enhance trading confidence level.
Level 3 : comprehensive indicator/strategy. They are simple trading systems based on my strategies. They are commonly containing several or all of entry signal, close signal, stop loss, take profit, re-entry, risk management, and position sizing techniques. Even some interesting fundamental and mass psychological aspects are incorporated.
Level 4 : script snippets or functions that do not disclose source code. Interesting element that can reveal market laws and work as raw material for indicators and strategies. If you find Level 1~2 scripts are helpful, Level 4 is a private version that took me far more efforts to develop.
Level 5 : indicator/strategy that do not disclose source code. private version of Level 3 script with my accumulated script processing skills or a large number of custom functions. I had a private function library built in past two years. Level 5 scripts use many of them to achieve private trading strategy.
Notas de prensa
OVERVIEWThis script combines multi-timeframe EMA analysis with a modified MACD oscillator to identify trending conditions and potential entry points. It visualizes bullish/bearish momentum through colored candle bars and provides buy/sell labels for actionable signals.
FEATURES
• Trend detection using 9 exponential moving averages (EMA) across 4-250 periods
• Integrated MACD histogram with dynamic coloring (bullish/red, bearish/blue)
• Real-time uptrend/downtrend condition highlighting via background shading
• Buy/sell signal labels at price levels where crossovers occur
• Zero line reference for neutral market identification
HOW TO USE
Open on any time frame chart (non-overlay mode required)
Monitor the following key elements:
- • Red/Yellow zones: Bullish momentum dominance • Blue/Fuchsia zones: Bearish momentum dominance • Background shade transitions: Confirm trend continuation strength
TREND INTERPRETATION GUIDE
• Uptrend confirmed when all EMAs show positive progression → Yellow background activated
• Downtrend validated by negative EMA slopes → Fuchsia background appears
• MACD bar colors indicate current momentum direction relative to prior values
LIMITATIONS
• Fixed parameter settings cannot be adjusted in real-time
• Requires sufficient historical data (>250 candles recommended) for accurate calculations
• Should not be used as standalone trading system - combine with other indicators
NOTES
• The 'stick-line' MACD plots represent composite trend behavior from multiple timeframes
• Label colors correspond to signal type (green-buying opportunity, red-selling indication)
• Backtesting may require parameter optimization due to fixed calculation lookbacks
Notas de prensa
█ OVERVIEWA merged MACD oscillator that overlays stick-line trend analysis on the classic MACD panel. BUY/SELL labels, ATR-based take-profit and stop-loss reference levels, and full alert support help you act on signals quickly.
█ CONCEPTS
The script combines three analytical layers:
• MACD Core: a standard fast/slow/signal EMA structure (12/26/9 by default) plotted as DIF and DEA lines with a colored fill between them.
• Stick-Line Ladder: eight EMAs of a short-term momentum spread act as a trend ladder; when the whole ladder rises while price holds above a trend EMA, the panel marks an uptrend merge, and a symmetric check marks a downtrend merge.
• Signal Governance: a position state machine with a cooldown window suppresses duplicate labels, so each MACD cross produces at most one actionable signal per direction.
█ HOW TO USE
1 — Add the script to a chart; the pane shows the DIF/DEA lines, MACD candles, and a status dashboard.
2 — Tune the MACD and stick-line lengths in settings if your market needs faster or slower response; defaults preserve the original behavior.
3 — Watch for BUY (green) and SELL (red) labels at MACD crosses; an orange X marks the exit of the previous position when a signal flips.
4 — Read the TP/SL reference prices from the Data Window or the dashboard after each signal.
5 — Create alerts from the alert list: BUY, SELL, uptrend/downtrend merge starts, and the low-zone warning.
Input Parameters
• MACD group: fast, slow and signal lengths (12/26/9 defaults).
• Stick-Line System group: DI fast/slow EMA lengths (4/13), trend EMA length (11), uptrend DI threshold (-0.8), warmup SMA gate length (34).
• Signal Governance group: same-bar entry/exit exclusivity toggle and cooldown bars (3, 0 disables).
• Risk group: TP/SL display toggle, ATR length (14), stop-loss multiplier (2.0 xATR), take-profit multiplier (3.0 xATR).
• Visual group: dashboard toggle, trend-merge background toggle, low-warning background toggle.
█ FEATURES
• BUY/SELL labels driven by a position state machine with configurable cooldown
• ATR-based stop-loss and take-profit levels shown in the Data Window and dashboard
• Five alertcondition channels plus a confirmed-close alert message
• Status backgrounds: light green for uptrend merge, light blue for downtrend merge, yellow flash for the low-zone warning
• On-chart dashboard with MACD bias, trend state, position state and TP/SL prices
• Label history managed with a 500-label cap
█ SIGNALS
Visual Elements
• DIF/DEA lines and fill: yellow fill while DIF is above DEA, fuchsia while below
• Orange/blue MACD candles: histogram color follows whether MACD expanded or contracted versus the prior bar
• Orange overlay candles: uptrend merge in progress
• Blue overlay candles: downtrend merge in progress
• BUY label (green, below the line): MACD golden cross accepted by the state machine
• SELL label (red, above the line): MACD dead cross accepted by the state machine
• X mark (orange): previous long or short position closed by the opposite signal
• Yellow background flash: low-zone warning from the internal bounce scanner
• Dashboard rows: MACD bias, trend merge state, position state, TP/SL prices
█ IMPLEMENTATION NOTES
Open-source implementation built on ta.ema, ta.atr, ta.crossover/ta.crossunder and two helper functions (xrf, xsa) inherited from the original script. Signals are evaluated on closed bars: the entry alert is guarded by barstate.isconfirmed and fires with alert.freq_once_per_bar_close, so no intrabar repainting occurs. Division branches are guarded against zero denominators, and every threshold is exposed as an input with minval/maxval constraints.
█ LIMITATIONS
• Trend-merge states lag fast reversals because the ladder uses EMAs up to 250 bars
• Cooldown and state filtering intentionally skip repeated crosses inside a trend; set cooldown to 0 for the raw cross sequence
• TP/SL levels are reference prices for the Data Window, not lines on the price chart, because this pane is an oscillator
• Best suited to trending markets; expect whipsaw labels in tight ranges
█ NOTES
• Version 2 adds signal governance, ATR-based risk levels, status backgrounds, a dashboard, and a complete alert system while keeping the original merged-MACD algorithm unchanged
• Credit to the original blackcat L1 Stick-Line Merged MACD
════════════════════════════════════════════════════════════════════════
For questions or feedback, please use the comments section below.
Feel free to use and modify — attribution appreciated.

Don't miss out! The first and most important thing to do is to join my Discord chat now! Click here to start your adventure: discord.com/invite/ZTGpQJq My new github for more pine development soon: github.com/wxt-coder
Exención de responsabilidad
La información y las publicaciones no constituyen, ni deben considerarse como, asesoramiento o recomendaciones financieras, de inversión, de trading u otro tipo, proporcionadas o respaldadas por TradingView. Obtenga más información en Condiciones de uso.
Don't miss out! The first and most important thing to do is to join my Discord chat now! Click here to start your adventure: discord.com/invite/ZTGpQJq My new github for more pine development soon: github.com/wxt-coder
Exención de responsabilidad
La información y las publicaciones no constituyen, ni deben considerarse como, asesoramiento o recomendaciones financieras, de inversión, de trading u otro tipo, proporcionadas o respaldadas por TradingView. Obtenga más información en Condiciones de uso.