OPEN-SOURCE SCRIPT
RSI Grid Search Heatmap
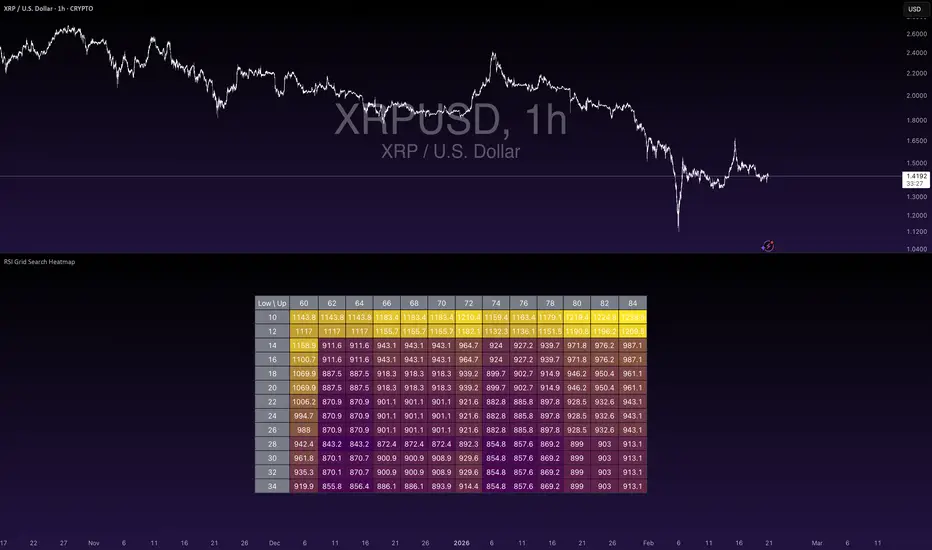
Welcome to this open source educational script. I built this as a foundational template for developers and traders who want to visualize the robustness of their strategies directly on the chart.
Please note that the included RSI strategy is just a placeholder. The main goal here is to give you the code architecture so you can plug in your own trading logic, indicators, and custom metrics.
What is a Grid Search?
If you are wondering what a grid search is, it is a very common concept used in data science and quantitative analysis. Instead of guessing which parameter combination works best, a grid search tests a whole grid of possibilities systematically.
For example, instead of just testing a standard RSI setup of 30 and 70, a grid search tests every combination in between, like 20 and 60, 25 and 65, 30 and 75, and so on. This is incredibly useful for testing the robustness of a strategy. If one specific setting is highly profitable but the settings right next to it lose money, your strategy is likely overfitted to the historical data. A truly robust strategy will show a solid cluster of profitable results.
What do you see on the chart?
When you apply this script, it projects a heatmap table directly onto your chart.
The Y-axis represents the lower threshold (for example, the oversold entry level).
The X-axis represents the upper threshold (for example, the overbought exit level).
Inside each cell, you will see the final equity based on a starting capital of 1000.
The colors use a gradient from dark purple for low performance to bright yellow for the highest profit.
If you see cells that show exactly 1000, it simply means no trades were executed for that specific parameter combination within the tested historical period.
How does it work exactly?
Pine Script is not naturally built to process massive amounts of historical data inside a single loop. To make this work without hitting the TradingView loop execution limits, the script uses a specific workaround.
It stores a limited number of historical data points in custom arrays while the chart loads. This is determined by the lookback period in the code. Then, on the very last historical bar, it runs a nested loop over your defined parameter ranges. It backtests the simple logic against the stored arrays and plots the results in a table. Because Pine Script does not support arrays within arrays, it uses a custom type object to store the grid data and map it correctly to the heatmap cells.
Feel free to copy the code, strip out the RSI logic, and build your own system. You can easily expand this to track maximum drawdown, win rate, or even test dynamic stop losses.
Disclaimer: This script is strictly for educational and informational purposes only. It does not constitute financial advice or a recommendation to buy or sell any asset. Trading in financial markets involves a high degree of risk and may not be suitable for all investors. Always do your own research and backtesting before committing real capital.
Islamic Finance Disclaimer: Please ensure that your trading activities, the specific assets you choose to trade, and the accounts you use comply with Islamic finance principles (Sharia law). This includes avoiding trading with interest-based leverage (Riba) and ensuring you do not trade prohibited (Haram) assets.
Please note that the included RSI strategy is just a placeholder. The main goal here is to give you the code architecture so you can plug in your own trading logic, indicators, and custom metrics.
What is a Grid Search?
If you are wondering what a grid search is, it is a very common concept used in data science and quantitative analysis. Instead of guessing which parameter combination works best, a grid search tests a whole grid of possibilities systematically.
For example, instead of just testing a standard RSI setup of 30 and 70, a grid search tests every combination in between, like 20 and 60, 25 and 65, 30 and 75, and so on. This is incredibly useful for testing the robustness of a strategy. If one specific setting is highly profitable but the settings right next to it lose money, your strategy is likely overfitted to the historical data. A truly robust strategy will show a solid cluster of profitable results.
What do you see on the chart?
When you apply this script, it projects a heatmap table directly onto your chart.
The Y-axis represents the lower threshold (for example, the oversold entry level).
The X-axis represents the upper threshold (for example, the overbought exit level).
Inside each cell, you will see the final equity based on a starting capital of 1000.
The colors use a gradient from dark purple for low performance to bright yellow for the highest profit.
If you see cells that show exactly 1000, it simply means no trades were executed for that specific parameter combination within the tested historical period.
How does it work exactly?
Pine Script is not naturally built to process massive amounts of historical data inside a single loop. To make this work without hitting the TradingView loop execution limits, the script uses a specific workaround.
It stores a limited number of historical data points in custom arrays while the chart loads. This is determined by the lookback period in the code. Then, on the very last historical bar, it runs a nested loop over your defined parameter ranges. It backtests the simple logic against the stored arrays and plots the results in a table. Because Pine Script does not support arrays within arrays, it uses a custom type object to store the grid data and map it correctly to the heatmap cells.
Feel free to copy the code, strip out the RSI logic, and build your own system. You can easily expand this to track maximum drawdown, win rate, or even test dynamic stop losses.
Disclaimer: This script is strictly for educational and informational purposes only. It does not constitute financial advice or a recommendation to buy or sell any asset. Trading in financial markets involves a high degree of risk and may not be suitable for all investors. Always do your own research and backtesting before committing real capital.
Islamic Finance Disclaimer: Please ensure that your trading activities, the specific assets you choose to trade, and the accounts you use comply with Islamic finance principles (Sharia law). This includes avoiding trading with interest-based leverage (Riba) and ensuring you do not trade prohibited (Haram) assets.
Script de código abierto
Fiel al espíritu de TradingView, el creador de este script lo ha convertido en código abierto, para que los traders puedan revisar y verificar su funcionalidad. ¡Enhorabuena al autor! Aunque puede utilizarlo de forma gratuita, recuerde que cualquier republicación del código está sujeta a nuestras Normas internas.

Exención de responsabilidad
La información y las publicaciones no constituyen, ni deben considerarse como, asesoramiento o recomendaciones financieras, de inversión, de trading u otro tipo, proporcionadas o respaldadas por TradingView. Obtenga más información en Condiciones de uso.
Script de código abierto
Fiel al espíritu de TradingView, el creador de este script lo ha convertido en código abierto, para que los traders puedan revisar y verificar su funcionalidad. ¡Enhorabuena al autor! Aunque puede utilizarlo de forma gratuita, recuerde que cualquier republicación del código está sujeta a nuestras Normas internas.
Exención de responsabilidad
La información y las publicaciones no constituyen, ni deben considerarse como, asesoramiento o recomendaciones financieras, de inversión, de trading u otro tipo, proporcionadas o respaldadas por TradingView. Obtenga más información en Condiciones de uso.