OPEN-SOURCE SCRIPT
Actualizado Stochastic Momentum Index - SMI

🎯 Overview
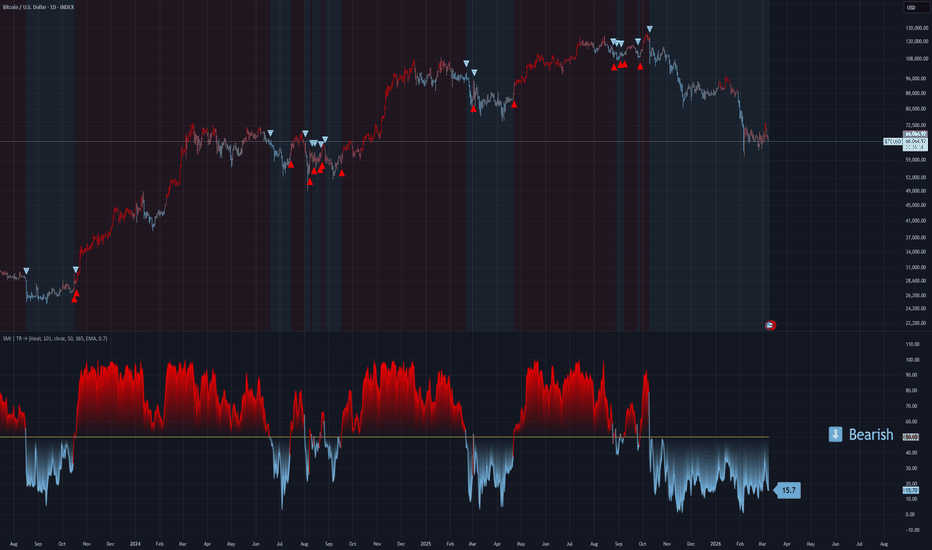
This is a Stochastic Momentum Index (SMI) indicator that combines stochastic momentum with moving average smoothing to identify trend direction and momentum strength in financial markets. The SMI measures where the current price closes relative to the midpoint of its recent trading range, providing enhanced sensitivity to price momentum.
🧩 Core Components
1. ⚙️ Technical Foundation
📊 Primary Calculation: Uses TradingView's built-in ta.stoch() function
📈 Range-Based: Compares closing price to high-low range over specified period
🎯 Scale: Oscillates between 0-100 with 50 as neutral midpoint
2. 🎛️ Configuration Parameters
📏 SMI Length: Default 101 periods (long-term smoothing)
📊 Source Price: Customizable (default = Close)
📈 MA Length: 30-period moving average applied to SMI
🔄 MA Type: 6 options (EMA, SMA, RMA, WMA, VWMA, HMA)
🎨 Color Themes: 5 visual schemes (Classic, Modern, Robust, Accented, Monochrome)
📈 Signal Interpretation:
🟢 BULLISH: SMI > 50 (price closing in upper half of range)
🔴 BEARISH: SMI < 50 (price closing in lower half of range)
🎯 Neutral Zone: Around 50 indicates balanced momentum
👁️ Visual Features
📈 Signal Line (MA):
Yellow moving average of SMI
Smooths momentum for clearer trend identification
🎯 Reference Lines:
50-level midpoint (white dashed line)
0-100 scale boundaries
🎨 Fill Zones:
🟢 Upper Zone : Bullish momentum area
🔴 Lower Zone : Bearish momentum area
Gradient fills enhance visual clarity
📋 Dashboard Display:
Content: "⬆️ Bullish" or "⬇️ Bearish" indicator
Purpose: Quick market bias assessment
⚡ Trading Applications
📈 Primary Uses:
🎯 Trend Identification
SMI > 50 = Uptrend momentum
SMI < 50 = Downtrend momentum
📊 Momentum Strength
Values near 100 = Strong bullish momentum
Values near 0 = Strong bearish momentum
Values around 50 = Neutral/consolidation
🔄 Mean Reversion
Extreme readings (near 0 or 100) may indicate overbought/oversold conditions
⏰ Timeframe Compatibility:
📅 Long-term: 101-period default suits swing/position trading
📊 Medium-term: Adjust lengths for daily/weekly analysis
⚡ Short-term: Reduce periods for intraday trading
🎨 Customization Options
🔄 Moving Average Types:
📉 EMA: Exponential - responsive to recent changes
📊 SMA: Simple - equal weight to all periods
📈 RMA: Relative - TradingView's special moving average
⚖️ WMA: Weighted - emphasizes recent data
💎 VWMA: Volume-weighted - incorporates volume
🚀 HMA: Hull - reduces lag significantly
🎨 Visual Themes:
🎨 Classic: Green/Red (traditional trading colors)
🚀 Modern: Cyan/Purple (modern aesthetic)
💪 Robust: Amber/Deep Purple (high contrast)
🌈 Accented: Purple/Magenta (vibrant)
⚫⚪ Monochrome: Light Gray/Dark Gray (minimalist)
🔔 Alert System
🟢 LONG Alert: Triggers when SMI crosses above 50
🔴 SHORT Alert: Triggers when SMI crosses below 50
📧 Format: Includes ticker symbol for easy identification
⚡ Key Advantages
✅ Strengths:
🎯 Clear Signals: Simple >50/<50 threshold for easy interpretation
📊 Range-Bound: Always oscillates 0-100 (no divergence issues)
👁️ Visual Clarity: Color-coded zones make analysis intuitive
🔄 Customizable: Multiple MA types and visual themes
📱 Professional: Clean, organized display suitable for all traders
This is a Stochastic Momentum Index (SMI) indicator that combines stochastic momentum with moving average smoothing to identify trend direction and momentum strength in financial markets. The SMI measures where the current price closes relative to the midpoint of its recent trading range, providing enhanced sensitivity to price momentum.
🧩 Core Components
1. ⚙️ Technical Foundation
📊 Primary Calculation: Uses TradingView's built-in ta.stoch() function
📈 Range-Based: Compares closing price to high-low range over specified period
🎯 Scale: Oscillates between 0-100 with 50 as neutral midpoint
2. 🎛️ Configuration Parameters
📏 SMI Length: Default 101 periods (long-term smoothing)
📊 Source Price: Customizable (default = Close)
📈 MA Length: 30-period moving average applied to SMI
🔄 MA Type: 6 options (EMA, SMA, RMA, WMA, VWMA, HMA)
🎨 Color Themes: 5 visual schemes (Classic, Modern, Robust, Accented, Monochrome)
📈 Signal Interpretation:
🟢 BULLISH: SMI > 50 (price closing in upper half of range)
🔴 BEARISH: SMI < 50 (price closing in lower half of range)
🎯 Neutral Zone: Around 50 indicates balanced momentum
👁️ Visual Features
📈 Signal Line (MA):
Yellow moving average of SMI
Smooths momentum for clearer trend identification
🎯 Reference Lines:
50-level midpoint (white dashed line)
0-100 scale boundaries
🎨 Fill Zones:
🟢 Upper Zone : Bullish momentum area
🔴 Lower Zone : Bearish momentum area
Gradient fills enhance visual clarity
📋 Dashboard Display:
Content: "⬆️ Bullish" or "⬇️ Bearish" indicator
Purpose: Quick market bias assessment
⚡ Trading Applications
📈 Primary Uses:
🎯 Trend Identification
SMI > 50 = Uptrend momentum
SMI < 50 = Downtrend momentum
📊 Momentum Strength
Values near 100 = Strong bullish momentum
Values near 0 = Strong bearish momentum
Values around 50 = Neutral/consolidation
🔄 Mean Reversion
Extreme readings (near 0 or 100) may indicate overbought/oversold conditions
⏰ Timeframe Compatibility:
📅 Long-term: 101-period default suits swing/position trading
📊 Medium-term: Adjust lengths for daily/weekly analysis
⚡ Short-term: Reduce periods for intraday trading
🎨 Customization Options
🔄 Moving Average Types:
📉 EMA: Exponential - responsive to recent changes
📊 SMA: Simple - equal weight to all periods
📈 RMA: Relative - TradingView's special moving average
⚖️ WMA: Weighted - emphasizes recent data
💎 VWMA: Volume-weighted - incorporates volume
🚀 HMA: Hull - reduces lag significantly
🎨 Visual Themes:
🎨 Classic: Green/Red (traditional trading colors)
🚀 Modern: Cyan/Purple (modern aesthetic)
💪 Robust: Amber/Deep Purple (high contrast)
🌈 Accented: Purple/Magenta (vibrant)
⚫⚪ Monochrome: Light Gray/Dark Gray (minimalist)
🔔 Alert System
🟢 LONG Alert: Triggers when SMI crosses above 50
🔴 SHORT Alert: Triggers when SMI crosses below 50
📧 Format: Includes ticker symbol for easy identification
⚡ Key Advantages
✅ Strengths:
🎯 Clear Signals: Simple >50/<50 threshold for easy interpretation
📊 Range-Bound: Always oscillates 0-100 (no divergence issues)
👁️ Visual Clarity: Color-coded zones make analysis intuitive
🔄 Customizable: Multiple MA types and visual themes
📱 Professional: Clean, organized display suitable for all traders
Notas de prensa
New Indicator CreateStochastic Momentum Index - SMI | TR
Script de código abierto
Fiel al espíritu de TradingView, el creador de este script lo ha convertido en código abierto, para que los traders puedan revisar y verificar su funcionalidad. ¡Enhorabuena al autor! Aunque puede utilizarlo de forma gratuita, recuerde que cualquier republicación del código está sujeta a nuestras Normas internas.

Exención de responsabilidad
La información y las publicaciones no constituyen, ni deben considerarse como, asesoramiento o recomendaciones financieras, de inversión, de trading u otro tipo, proporcionadas o respaldadas por TradingView. Obtenga más información en Condiciones de uso.
Script de código abierto
Fiel al espíritu de TradingView, el creador de este script lo ha convertido en código abierto, para que los traders puedan revisar y verificar su funcionalidad. ¡Enhorabuena al autor! Aunque puede utilizarlo de forma gratuita, recuerde que cualquier republicación del código está sujeta a nuestras Normas internas.
Exención de responsabilidad
La información y las publicaciones no constituyen, ni deben considerarse como, asesoramiento o recomendaciones financieras, de inversión, de trading u otro tipo, proporcionadas o respaldadas por TradingView. Obtenga más información en Condiciones de uso.