ICT Killzones Minimal - Liquidity Map
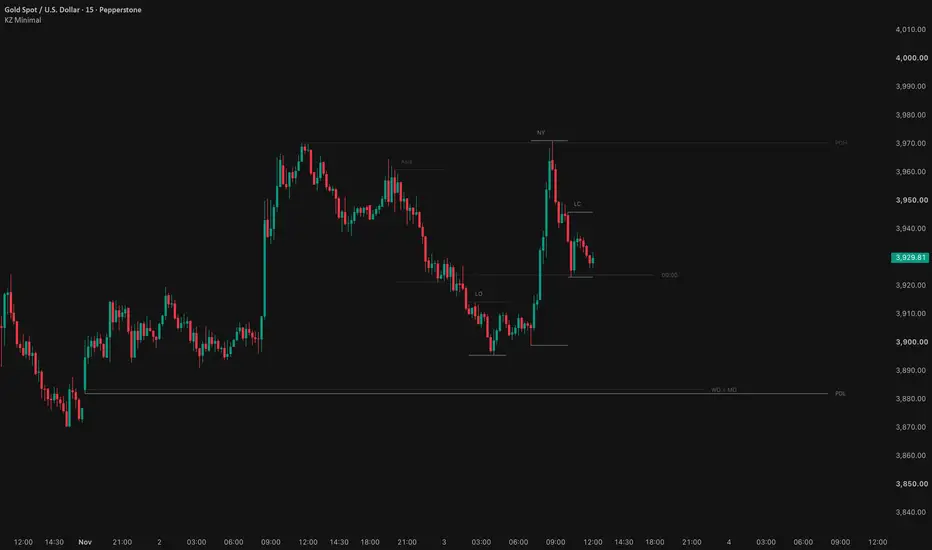
ICT Killzones Minimal turns your chart into a liquidity map: line length shows how important a level is, line style shows what kind of level it is, and liquidity that has been taken fades away. It shows ICT Killzones, the previous day, week and month High / Low, and the key opening prices together, in one gray color with thin lines, for traders who use ICT and SMC concepts.
WHY IT IS DIFFERENT
Most killzone indicators draw everything with bright colors and fills. The chart fills up fast, and it gets hard to tell which level matters. This indicator does the opposite: it shows fewer things and lets their shape tell you what they are.

Figure 1. Swept liquidity fades: PDH has been taken and fades, while PDL is still untapped and stays bright. NY and Asia show a one-sided fade; LC has been swept on both sides.

Figure 2. Exact merge, with PWH / PWL and PMH / PML enabled: PWL = PML share one label. PDL, only a few points away, keeps its own label.

Figure 3. Focus Mode: Current Week, with Day Label and Separator enabled.

Figure 4. Focus Mode: Current Day, same moment as Figure 3.
COMPONENTS


Figures 5-7. Killzone display options: Box, Background and Start / End. High / Low, the default, is shown in the main chart. The fill transparency of Box and Background can be adjusted.
HOW IT WORKS
HOW TO USE
LIMITATIONS
AUTHOR'S NOTE
This indicator was built around one question: what can be removed? Every line on the chart should earn its place. If you have feedback or ideas that keep the chart simple, leave a comment below.
WHY IT IS DIFFERENT
Most killzone indicators draw everything with bright colors and fills. The chart fills up fast, and it gets hard to tell which level matters. This indicator does the opposite: it shows fewer things and lets their shape tell you what they are.
- Line length = importance. Reference prices are short, liquidity is long: Daily Opens (20 bars) < WO / MO (40) < PDH / PDL, PWH / PWL, PMH / PML (80). The labels line up in columns, so you see which level is the bigger liquidity without reading them.
- Line style = level type. Solid is liquidity (killzone High / Low and the previous day, week and month High / Low). Dotted is an opening price, a reference price. Everything is one color, yet every line is readable by its style.
- Swept liquidity fades. (Figure 1) Once price trades beyond a killzone High / Low or a PDH / PDL, PWH / PWL, PMH / PML, that liquidity has been taken: its line fades and its label stays at half strength. Only untapped liquidity, the levels price may still be drawn to, stays bright. The line count shrinks through the day instead of growing. The fade strength is adjustable; at 100, swept levels are hidden completely (line and label).
- Only exact prices merge. (Figure 2) When two or more levels are equal to the tick, they share one label, such as PWL = PML or WO = MO, so you see at once that several levels sit at one price. Levels that are close but not equal are never merged.
- Focus Mode. (Figures 3 and 4) Dims everything before today (Current Day) or before this week (Current Week) with your chart background color, so you focus on the price action that matters now. In Current Day, only today's separator and day label are shown.
- Minimal by default. One gray color. When first added, only the killzone High / Low, PDH / PDL, NY Midnight Open, WO and MO are shown. Everything else is one checkbox away.
Figure 1. Swept liquidity fades: PDH has been taken and fades, while PDL is still untapped and stays bright. NY and Asia show a one-sided fade; LC has been swept on both sides.
Figure 2. Exact merge, with PWH / PWL and PMH / PML enabled: PWL = PML share one label. PDL, only a few points away, keeps its own label.
Figure 3. Focus Mode: Current Week, with Day Label and Separator enabled.
Figure 4. Focus Mode: Current Day, same moment as Figure 3.
COMPONENTS
- Focus Mode: Current Day / Current Week, with adjustable strength (Opacity). Works on dark and light themes.
- ICT Killzones: Asia (20:00-00:00), London (02:00-05:00), New York (07:00-10:00), London Close (10:00-12:00), New York PM (13:30-16:00, off by default). All times are New York time, and Daylight Saving Time is handled automatically. Display: High / Low (default), Box, Background or Start / End. The label shows the name, the session range (pips, ticks or price), or both.
- Previous Levels: PDH / PDL (on by default), PWH / PWL, PMH / PML. Each line starts at the candle where that High / Low formed.
- Daily Opens: NY Midnight Open (00:00, True Day Open, on by default), 08:30, 09:30 (RTH) and 13:30. Each open stays on the chart with its label until the same time comes again the next day.
- Weekly & Monthly Opens: WO and MO.
- Days: day names (MON-FRI) pinned to the chart edge, and day separators.
- Alerts: Killzone Raid (price takes a finished killzone's High / Low for the first time), Level Raid (price takes PDH / PDL, PWH / PWL or PMH / PML for the first time), Killzone Start / End.
- Bar Replay safe: every drawing is placed by time, so backtesting in Replay does not hit history buffer errors.
- Mobile friendly: settings are grouped and laid out so every row fits the TradingView mobile app.
Figures 5-7. Killzone display options: Box, Background and Start / End. High / Low, the default, is shown in the main chart. The fill transparency of Box and Background can be adjusted.
HOW IT WORKS
- Killzones: session times are read in the America/New_York time zone, so Daylight Saving Time shifts are handled automatically. The killzone High / Low is tracked live while the session runs.
- Sweeps: a killzone High / Low counts as swept when a later candle trades beyond it after the killzone has ended. A previous day, week or month level counts as swept when the current day, week or month trades beyond it.
- Previous Levels and Opens: the previous day, week and month High / Low and the weekly and monthly opens come from the symbol's own higher-timeframe candles. The NY Midnight Open is the open of the candle at 00:00 New York time.
- Merging: two levels share a label only when their prices are equal to within half a tick.
- Line lengths: fixed bar offsets (20, 40 and 80 bars) measured from the current candle.
- Focus Mode: one fill per past day, sized to that day's range and painted with your chart background color.
HOW TO USE
- Use it on the 1 hour timeframe or lower.
- After a killzone ends, treat its High / Low and the Previous Levels as liquidity targets for the next session. A longer line means bigger liquidity.
- Read premium and discount from where price sits relative to the NY Midnight Open and the WO.
- Turn on Focus Mode before making a decision, to concentrate on today's price action.
- To create an alert, pick KZ Minimal under Condition and choose "Any alert() function call". One alert covers every enabled condition. Desktop notifications show the Alert name rather than the message, so give the alert a short name (for example "KZ Gold"); the full message appears on mobile, in the popup and in the Alerts log.
LIMITATIONS
- Above the 1 hour timeframe a single candle spans several sessions, so killzones and Daily Opens are hidden automatically.
- The day rollover and Previous Levels follow your broker's daily session. NY Midnight Open follows 00:00 New York time.
- If a level far from price (usually PMH / PML) squeezes the chart, right-click the price scale and choose "Scale price chart only".
- The distance of the pinned day labels from the chart edge is set by Chart Settings > Scales and lines > Margins. In Bar Replay, the previous day's label may stay after the day changes; restarting Replay refreshes it.
- Focus Mode draws its overlay above the chart to dim past candles. TradingView's own price line belongs to the chart, so it is dimmed too where it crosses the dimmed days. This is a deliberate trade-off within Pine's limits, not a bug. Today's area and the price tag on the price scale stay fully visible. With a gradient chart background, Pine can only read one color (the middle of the gradient), so the overlay shows as a flat band; use a solid background for a seamless look.
- Line lengths are measured in time. On Friday afternoon, lines that would extend into the weekend all end at the same point, because there are no bars over the weekend, so the length hierarchy compresses until the Sunday open.
- This indicator gives no trading signals and is not financial advice. It only shows time and price reference levels; every trading decision and its risk is your own.
- ICT and the killzone concepts are the work of their original creator. This script is an independent implementation and is not affiliated with or endorsed by The Inner Circle Trader.
AUTHOR'S NOTE
This indicator was built around one question: what can be removed? Every line on the chart should earn its place. If you have feedback or ideas that keep the chart simple, leave a comment below.

Exención de responsabilidad
La información y las publicaciones no constituyen, ni deben considerarse como, asesoramiento o recomendaciones financieras, de inversión, de trading u otro tipo, proporcionadas o respaldadas por TradingView. Obtenga más información en Condiciones de uso.
Exención de responsabilidad
La información y las publicaciones no constituyen, ni deben considerarse como, asesoramiento o recomendaciones financieras, de inversión, de trading u otro tipo, proporcionadas o respaldadas por TradingView. Obtenga más información en Condiciones de uso.