OPEN-SOURCE SCRIPT
Strong Liquidity Zones | ProjectSyndicate
Strong Liquidity Zones
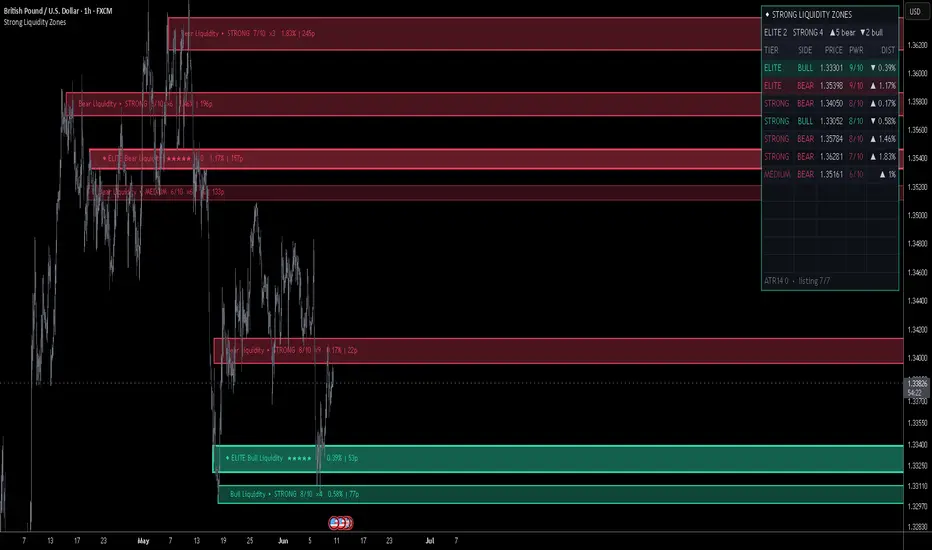
Strong Liquidity Zones finds the price levels where liquidity actually pools — then power-ranks them so you instantly know which zone is likely to hold and which is likely to give way. It detects three independent footprints of liquidity (swing pivots, wick-rejection traps, and volume spikes), merges overlapping detections into confluence clusters, and scores each cluster 0–10 from real, measurable level quality. Strong, multi-confluence zones are framed and highlighted; weak, single-touch zones stay faint. A live dashboard lists every viable level, ranked, so the whole map of support and resistance is readable at a glance.
🎯 Power-Ranking System (0–10) — every zone earns a live grade from four sign-stable factors: confluence (how many separate detections stack at the level, with diminishing returns so a single tap can't fake strength), detection diversity (a level confirmed by pivots and wick traps and volume carries far more weight than one confirmed a single way), detection strength (volume vs baseline, wick dominance, and range expansion on the forming candle), and recency (freshly defended levels score higher than stale ones). ELITE (9–10) is deliberately rare — it requires genuine all-three-type confluence on a strong, recent level, so the number reflects real edge, not decoration.
🏷️ In-Zone Strength Labels — each zone carries its grade inside the band: side (Bull/Bear), tier, the X/10 score, a star rating, the confluence count (×N detections that built it), and live distance from price in both % and pips. Quality and proximity read instantly without hunting through a panel.
🧲 Confluence Clustering — instead of plotting every raw detection as its own line, nearby detections are grouped into a single strength-weighted zone centered on where the liquidity truly sits. One clean level per pool, not a cluttered stack.
🥇 ELITE Highlighting — the strongest clusters are rendered as a brighter shade of the same side colour with a heavy border, so the levels that matter most stand out before you read a single number. Tier ladder: FAINT → WEAK → MEDIUM → STRONG → ELITE.
🎨 Strength-Shaded Fill — stronger zones render sharper and more opaque while weak ones stay faint, so the chart shows which levels carry weight at a glance.
📊 Live Level Dashboard — an on-chart leaderboard lists every active zone sorted by power and distance from price, with tier, side, exact price, score, and direction (▲ above / ▼ below). Adjustable position and text size (Small → Huge). See all viable levels at once, ranked.
📍 Origin-Anchored Zones — every zone is drawn from the bar where the level was first established and extends to the right, so each band is visually tied to the price action that created it — never floating in mid-air.
🔒 Stable, Lock-In Zones — zones are created only on confirmed bars and reconciled in place: once a zone is on the chart it keeps its grade, tier, and position and won't flicker or shuffle intraday. A zone is removed only when price genuinely breaches it or the level is invalidated — one clean transition, never random blinking.
🧹 Score Filter — hide every cluster below a chosen power rank so the chart only carries the levels that earned their place, plus a minimum-separation and minimum-distance-from-price control to keep the picture clean.
🔔 Native Alerts — dedicated alerts for an ELITE (9–10) cluster forming, a STRONG (7–8) cluster forming, a zone being breached, and fresh bullish / bearish liquidity detections — so you never miss a high-quality level appearing or failing.
🔧 Fully Customizable — detection sensitivity (pivot length, wick-dominance ratio, volume-spike multiplier, strength threshold), clustering (tolerance, lookback, minimum points, minimum rank, re-cluster interval, distance-from-price), zone geometry (ATR period, width, max active zones, separation), display (label size, fill opacity, elite border thickness), dashboard (position, rows, text size), and the full colour theme — all adjustable.
🎯 Why this is different — most "liquidity" or "support/resistance" tools dump every swing onto the chart and leave you to guess which line matters. This one fuses three independent liquidity footprints, clusters them into clean zones, and quantifies each one from real level quality — then tells you the probability-weighted answer: a STRONG/ELITE zone is one to fade, a WEAK zone is one that's likely to break. The scoring even informs how you trade each level (see below).
🚀 Apply to Gold (XAUUSD), Silver, Forex, Crypto, and Indices on any timeframe.
🎯 How To Trade It — Two Approaches
The score is the filter that decides which approach fits. Strong, multi-confluence zones tend to hold and reverse; weak, thin zones tend to break. So play them differently.
1) Fade the Zone — Reversion (use on STRONG / ELITE zones, ≥7)
Best when the zone price is approaching is rated STRONG or ELITE — these carry the most confluence and are statistically the most likely to hold.
Wait for price to tap into the high-grade zone (the dashboard's ▲/▼ distance shows it approaching).
Look for rejection: a wick into the band and a close back out of it — the liquidity above/below the level gets swept, then price turns.
Entry: on the reversal back out of the zone (close rejecting the band).
Stop: just beyond the far edge of the zone — if price closes through and holds, the level has failed and the fade thesis is wrong.
Targets: the next zone in the dashboard, then the opposite side's nearest strong zone.
Use the STRONG / ELITE cluster alert to know the moment a high-grade level appears, and the distance readout to time the tap.
2) Trade the Break — Continuation (use on WEAK / MEDIUM zones, or once a strong zone breaches)
Best when the level is rated WEAK or MEDIUM (thin, single-type, or stale) — these are the levels most likely to give way.
Wait for a decisive close through the zone on expanding volume — not a single wick.
The zone flipping from active to breached on the chart is your confirmation it's a genuine break, not a stop-hunt.
Entry: in the direction of the break on the close beyond the zone, or on a retest of the broken zone (a broken bull zone flips to resistance; a broken bear zone flips to support).
Stop: back inside the broken zone.
Targets: the next zone in that direction on the dashboard, trailing as the move extends.
Rule of thumb: ⭐ STRONG / ELITE → expect a reaction, fade the tap. ⭐ WEAK / MEDIUM on volume → expect follow-through, trade the break.
⚠️ IMPORTANT NOTICE: This indicator identifies high-probability liquidity levels and frames fade-vs-break scenarios. It should NOT be used as a standalone signal for entering trades. Always combine it with your own strategy, price-action analysis, and risk management to confirm setups. Past statistical behavior does not guarantee future results.
Strong Liquidity Zones finds the price levels where liquidity actually pools — then power-ranks them so you instantly know which zone is likely to hold and which is likely to give way. It detects three independent footprints of liquidity (swing pivots, wick-rejection traps, and volume spikes), merges overlapping detections into confluence clusters, and scores each cluster 0–10 from real, measurable level quality. Strong, multi-confluence zones are framed and highlighted; weak, single-touch zones stay faint. A live dashboard lists every viable level, ranked, so the whole map of support and resistance is readable at a glance.
🎯 Power-Ranking System (0–10) — every zone earns a live grade from four sign-stable factors: confluence (how many separate detections stack at the level, with diminishing returns so a single tap can't fake strength), detection diversity (a level confirmed by pivots and wick traps and volume carries far more weight than one confirmed a single way), detection strength (volume vs baseline, wick dominance, and range expansion on the forming candle), and recency (freshly defended levels score higher than stale ones). ELITE (9–10) is deliberately rare — it requires genuine all-three-type confluence on a strong, recent level, so the number reflects real edge, not decoration.
🏷️ In-Zone Strength Labels — each zone carries its grade inside the band: side (Bull/Bear), tier, the X/10 score, a star rating, the confluence count (×N detections that built it), and live distance from price in both % and pips. Quality and proximity read instantly without hunting through a panel.
🧲 Confluence Clustering — instead of plotting every raw detection as its own line, nearby detections are grouped into a single strength-weighted zone centered on where the liquidity truly sits. One clean level per pool, not a cluttered stack.
🥇 ELITE Highlighting — the strongest clusters are rendered as a brighter shade of the same side colour with a heavy border, so the levels that matter most stand out before you read a single number. Tier ladder: FAINT → WEAK → MEDIUM → STRONG → ELITE.
🎨 Strength-Shaded Fill — stronger zones render sharper and more opaque while weak ones stay faint, so the chart shows which levels carry weight at a glance.
📊 Live Level Dashboard — an on-chart leaderboard lists every active zone sorted by power and distance from price, with tier, side, exact price, score, and direction (▲ above / ▼ below). Adjustable position and text size (Small → Huge). See all viable levels at once, ranked.
📍 Origin-Anchored Zones — every zone is drawn from the bar where the level was first established and extends to the right, so each band is visually tied to the price action that created it — never floating in mid-air.
🔒 Stable, Lock-In Zones — zones are created only on confirmed bars and reconciled in place: once a zone is on the chart it keeps its grade, tier, and position and won't flicker or shuffle intraday. A zone is removed only when price genuinely breaches it or the level is invalidated — one clean transition, never random blinking.
🧹 Score Filter — hide every cluster below a chosen power rank so the chart only carries the levels that earned their place, plus a minimum-separation and minimum-distance-from-price control to keep the picture clean.
🔔 Native Alerts — dedicated alerts for an ELITE (9–10) cluster forming, a STRONG (7–8) cluster forming, a zone being breached, and fresh bullish / bearish liquidity detections — so you never miss a high-quality level appearing or failing.
🔧 Fully Customizable — detection sensitivity (pivot length, wick-dominance ratio, volume-spike multiplier, strength threshold), clustering (tolerance, lookback, minimum points, minimum rank, re-cluster interval, distance-from-price), zone geometry (ATR period, width, max active zones, separation), display (label size, fill opacity, elite border thickness), dashboard (position, rows, text size), and the full colour theme — all adjustable.
🎯 Why this is different — most "liquidity" or "support/resistance" tools dump every swing onto the chart and leave you to guess which line matters. This one fuses three independent liquidity footprints, clusters them into clean zones, and quantifies each one from real level quality — then tells you the probability-weighted answer: a STRONG/ELITE zone is one to fade, a WEAK zone is one that's likely to break. The scoring even informs how you trade each level (see below).
🚀 Apply to Gold (XAUUSD), Silver, Forex, Crypto, and Indices on any timeframe.
🎯 How To Trade It — Two Approaches
The score is the filter that decides which approach fits. Strong, multi-confluence zones tend to hold and reverse; weak, thin zones tend to break. So play them differently.
1) Fade the Zone — Reversion (use on STRONG / ELITE zones, ≥7)
Best when the zone price is approaching is rated STRONG or ELITE — these carry the most confluence and are statistically the most likely to hold.
Wait for price to tap into the high-grade zone (the dashboard's ▲/▼ distance shows it approaching).
Look for rejection: a wick into the band and a close back out of it — the liquidity above/below the level gets swept, then price turns.
Entry: on the reversal back out of the zone (close rejecting the band).
Stop: just beyond the far edge of the zone — if price closes through and holds, the level has failed and the fade thesis is wrong.
Targets: the next zone in the dashboard, then the opposite side's nearest strong zone.
Use the STRONG / ELITE cluster alert to know the moment a high-grade level appears, and the distance readout to time the tap.
2) Trade the Break — Continuation (use on WEAK / MEDIUM zones, or once a strong zone breaches)
Best when the level is rated WEAK or MEDIUM (thin, single-type, or stale) — these are the levels most likely to give way.
Wait for a decisive close through the zone on expanding volume — not a single wick.
The zone flipping from active to breached on the chart is your confirmation it's a genuine break, not a stop-hunt.
Entry: in the direction of the break on the close beyond the zone, or on a retest of the broken zone (a broken bull zone flips to resistance; a broken bear zone flips to support).
Stop: back inside the broken zone.
Targets: the next zone in that direction on the dashboard, trailing as the move extends.
Rule of thumb: ⭐ STRONG / ELITE → expect a reaction, fade the tap. ⭐ WEAK / MEDIUM on volume → expect follow-through, trade the break.
⚠️ IMPORTANT NOTICE: This indicator identifies high-probability liquidity levels and frames fade-vs-break scenarios. It should NOT be used as a standalone signal for entering trades. Always combine it with your own strategy, price-action analysis, and risk management to confirm setups. Past statistical behavior does not guarantee future results.
Script de código abierto
Fiel al espíritu de TradingView, el creador de este script lo ha convertido en código abierto, para que los traders puedan revisar y verificar su funcionalidad. ¡Enhorabuena al autor! Aunque puede utilizarlo de forma gratuita, recuerde que cualquier republicación del código está sujeta a nuestras Normas internas.

Institutional-desk · 10+ yrs building trading algos
Syndicate Ultimate · 4 systems · 1 bundle
· 1 payment · lifetime access
Gold · FX · NQ/ES · private systems
syndicate001.com
TG channel
t.me/aisyndicate001
Syndicate Ultimate · 4 systems · 1 bundle
· 1 payment · lifetime access
Gold · FX · NQ/ES · private systems
syndicate001.com
TG channel
t.me/aisyndicate001
Exención de responsabilidad
La información y las publicaciones no constituyen, ni deben considerarse como, asesoramiento o recomendaciones financieras, de inversión, de trading u otro tipo, proporcionadas o respaldadas por TradingView. Obtenga más información en Condiciones de uso.
Script de código abierto
Fiel al espíritu de TradingView, el creador de este script lo ha convertido en código abierto, para que los traders puedan revisar y verificar su funcionalidad. ¡Enhorabuena al autor! Aunque puede utilizarlo de forma gratuita, recuerde que cualquier republicación del código está sujeta a nuestras Normas internas.
Institutional-desk · 10+ yrs building trading algos
Syndicate Ultimate · 4 systems · 1 bundle
· 1 payment · lifetime access
Gold · FX · NQ/ES · private systems
syndicate001.com
TG channel
t.me/aisyndicate001
Syndicate Ultimate · 4 systems · 1 bundle
· 1 payment · lifetime access
Gold · FX · NQ/ES · private systems
syndicate001.com
TG channel
t.me/aisyndicate001
Exención de responsabilidad
La información y las publicaciones no constituyen, ni deben considerarse como, asesoramiento o recomendaciones financieras, de inversión, de trading u otro tipo, proporcionadas o respaldadas por TradingView. Obtenga más información en Condiciones de uso.