OPEN-SOURCE SCRIPT
Actualizado VWAP + Order Flow
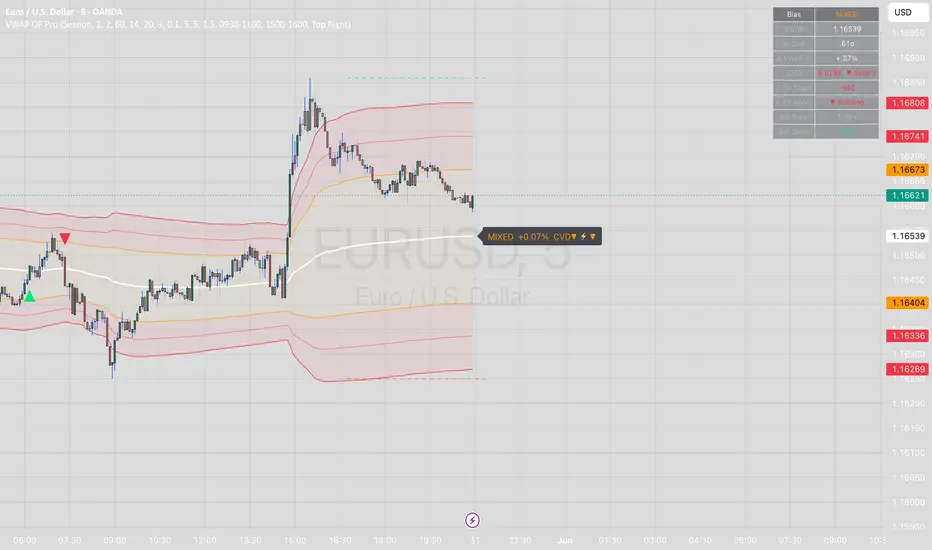
VWAP + Order Flow Pro — Institutional Bias, Volume Delta & High-Conviction Signals
Most VWAP indicators just draw a line. This one reads the market behind the line.
VWAP + Order Flow Pro combines volume-weighted average price with approximated order flow (bar delta + cumulative volume delta) to identify three specific setups where institutional activity is most likely to drive the next move.
THREE SIGNALS — ALL REQUIRE CONFLUENCE
▲▼ Signal A — Institutional Reclaim
Price spends 3+ bars on the wrong side of VWAP, then reclaims it with a decisive body (≥50% of range), strong delta (>0.6× average volume), and CVD that is both positive and accelerating. Not every VWAP cross — only ones with real buying or selling behind them.
▲▼ Signal B — Band Absorption
Price wicks beyond the ±2σ band by a configurable minimum extension, then closes back inside ±1.5σ. The bar must be wick-dominant (wick/body ratio >1.5), with opposing delta >0.5× average volume and expanding participation. Designed to catch institutional absorption of retail breakout attempts.
◆ Signal C — CVD Pivot Divergence
Price prints a new high or low at a pivot, but cumulative volume delta does not confirm. Hidden buying or distribution. Only fires within ±1.5σ of VWAP with CVD accelerating in the divergence direction.
WHAT MAKES THIS DIFFERENT
No repaint. All signals are gated by barstate.isconfirmed. Divergence signals use pivot lag by design — the delay is the protection.
Adaptive lengths. CVD slope, volume average, and cooldown periods auto-tune to your chart timeframe (1m through 1H+). No manual adjustment needed when switching TFs.
Signal cooldown. Prevents signal spam during chop. Configurable.
Volume filter. Signals require volume above a user-defined multiple of average. Default 1.5×.
Session filter. Optional restriction to high-probability windows: open 90 minutes + close 60 minutes. Built for equities and futures. Leave off for crypto and FX.
WHAT'S ON THE CHART
VWAP with ±1σ, ±1.5σ, ±2σ bands (all toggleable)
Optional HTF VWAP overlay (user-defined timeframe, no repaint)
Bar coloring by delta intensity — teal = buy-dominant, red = sell-dominant
Session high/low dashed lines
Floating bias label: BULL / BEAR / MIXED + CVD direction + acceleration indicator
Stats table: Bias, VWAP price, σ-distance, % from VWAP, CVD, CVD slope, CVD acceleration, volume ratio, bar delta
ALERTS
Five alert conditions built in: Long Signal, Short Signal, Bullish CVD Divergence, Bearish CVD Divergence, VWAP Cross (any direction).
HONEST DISCLOSURE
The order flow in this indicator is approximated, not real. TradingView does not provide bid/ask tape or Level 2 data. Bar delta is calculated from where the close sits within the bar's range — a widely used proxy, but not a substitute for a true footprint chart. Signals are designed to be high-probability, not high-frequency. Fewer signals, better quality.
This indicator is for educational and analytical purposes. Past signals do not guarantee future results. Always use proper risk management.
Works on: Equities · Futures · Crypto · FX
Best timeframes: 1m · 3m · 5m · 15m · 30m · 1H
Most VWAP indicators just draw a line. This one reads the market behind the line.
VWAP + Order Flow Pro combines volume-weighted average price with approximated order flow (bar delta + cumulative volume delta) to identify three specific setups where institutional activity is most likely to drive the next move.
THREE SIGNALS — ALL REQUIRE CONFLUENCE
▲▼ Signal A — Institutional Reclaim
Price spends 3+ bars on the wrong side of VWAP, then reclaims it with a decisive body (≥50% of range), strong delta (>0.6× average volume), and CVD that is both positive and accelerating. Not every VWAP cross — only ones with real buying or selling behind them.
▲▼ Signal B — Band Absorption
Price wicks beyond the ±2σ band by a configurable minimum extension, then closes back inside ±1.5σ. The bar must be wick-dominant (wick/body ratio >1.5), with opposing delta >0.5× average volume and expanding participation. Designed to catch institutional absorption of retail breakout attempts.
◆ Signal C — CVD Pivot Divergence
Price prints a new high or low at a pivot, but cumulative volume delta does not confirm. Hidden buying or distribution. Only fires within ±1.5σ of VWAP with CVD accelerating in the divergence direction.
WHAT MAKES THIS DIFFERENT
No repaint. All signals are gated by barstate.isconfirmed. Divergence signals use pivot lag by design — the delay is the protection.
Adaptive lengths. CVD slope, volume average, and cooldown periods auto-tune to your chart timeframe (1m through 1H+). No manual adjustment needed when switching TFs.
Signal cooldown. Prevents signal spam during chop. Configurable.
Volume filter. Signals require volume above a user-defined multiple of average. Default 1.5×.
Session filter. Optional restriction to high-probability windows: open 90 minutes + close 60 minutes. Built for equities and futures. Leave off for crypto and FX.
WHAT'S ON THE CHART
VWAP with ±1σ, ±1.5σ, ±2σ bands (all toggleable)
Optional HTF VWAP overlay (user-defined timeframe, no repaint)
Bar coloring by delta intensity — teal = buy-dominant, red = sell-dominant
Session high/low dashed lines
Floating bias label: BULL / BEAR / MIXED + CVD direction + acceleration indicator
Stats table: Bias, VWAP price, σ-distance, % from VWAP, CVD, CVD slope, CVD acceleration, volume ratio, bar delta
ALERTS
Five alert conditions built in: Long Signal, Short Signal, Bullish CVD Divergence, Bearish CVD Divergence, VWAP Cross (any direction).
HONEST DISCLOSURE
The order flow in this indicator is approximated, not real. TradingView does not provide bid/ask tape or Level 2 data. Bar delta is calculated from where the close sits within the bar's range — a widely used proxy, but not a substitute for a true footprint chart. Signals are designed to be high-probability, not high-frequency. Fewer signals, better quality.
This indicator is for educational and analytical purposes. Past signals do not guarantee future results. Always use proper risk management.
Works on: Equities · Futures · Crypto · FX
Best timeframes: 1m · 3m · 5m · 15m · 30m · 1H
Notas de prensa
VWAP + Order Flow This indicator merges session-anchored VWAP with a bar-level order flow model (Cumulative Volume Delta) to generate three distinct signal types. The core idea: VWAP shows where the market's fair value sits, while CVD reveals whether institutional participants are genuinely supporting price at that level — or faking it.
━━━━━━━━━━━━━━━━━━━━
HOW VWAP IS CALCULATED
━━━━━━━━━━━━━━━━━━━━
Uses a manually anchored VWAP (Session, Week, or Month) with cumulative sums:
- cumVP += HLC3 × Volume (volume-weighted price sum)
- cumV += Volume (total volume)
- VWAP = cumVP / cumV
Standard deviation bands use the variance formula:
- Variance = (cumVP² / cumV) - VWAP²
- σ = √Variance
Bands plotted at ±1σ, ±1.5σ, ±2σ from VWAP. All cumulative sums reset at each anchor boundary.
━━━━━━━━━━━━━━━━━━━━
ORDER FLOW MODEL (BAR DELTA + CVD)
━━━━━━━━━━━━━━━━━━━━
Bar Delta estimates net buying/selling pressure per bar:
- Delta = Volume × ((close − low) − (high − close)) / (high − low)
This approximates aggressive buyer vs seller dominance within each bar without a real tick feed.
CVD (Cumulative Volume Delta) = running sum of bar deltas, reset per session anchor. CVD slope is measured as CVD[0] − CVD[N], revealing directional momentum. Acceleration is confirmed when current slope > prior slope (3-bar comparison).
━━━━━━━━━━━━━━━━━━━━
SIGNAL A — INSTITUTIONAL RECLAIM
━━━━━━━━━━━━━━━━━━━━
Fires when all conditions are confirmed on a closed bar:
- Price has spent ≥N consecutive bars below (or above) VWAP
- Current bar opens on wrong side, closes on correct side (straddle)
- Body ≥ 50% of total range (directional commitment)
- Bar delta > volume average × 0.6 (institutional participation)
- CVD slope positive and accelerating (buyers building)
- Volume > average × 1.3
Logic: prolonged mispricing followed by aggressive reclaim with volume acceleration = institutional accumulation/distribution at VWAP.
━━━━━━━━━━━━━━━━━━━━
SIGNAL B — BAND ABSORPTION
━━━━━━━━━━━━━━━━━━━━
Fires when:
- Wick extends > X% of price beyond ±2σ band
- Bar closes back inside ±1.5σ (absorption confirmed)
- Wick/body ratio > 1.5 (wick-dominant bar)
- Delta opposes the wick direction (buyers absorbing sell wicks)
- CVD accelerating in reversal direction
- Volume > average × 1.5
Logic: price extension beyond 2σ statistically overstretched. When accompanied by high volume and opposing delta, it indicates absorption — large players buying the extreme, not chasing it.
━━━━━━━━━━━━━━━━━━━━
SIGNAL C — CVD PIVOT DIVERGENCE
━━━━━━━━━━━━━━━━━━━━
Uses pivot point detection (configurable length) on both price and CVD series:
Bullish divergence: price pivot low < prior pivot low, while CVD pivot low > prior CVD pivot low. Bearish divergence: inverse.
Additional filters:
- Signal only fires within 1.5σ of VWAP (in relevant zone)
- CVD must be accelerating in divergence direction
- Volume expanding (> average × 1.2)
This signal is inherently lagged by pivot length bars — no repainting by design.
━━━━━━━━━━━━━━━━━━━━
ADAPTIVE LENGTH TUNING
━━━━━━━━━━━━━━━━━━━━
When enabled, CVD slope length, volume average length, and cooldown bars auto-adjust based on chart timeframe (timeframe.in_seconds):
- ≤1m → CVD 21, Vol Avg 30, Cooldown 12
- ≤3m → CVD 18, Vol Avg 24, Cooldown 8
- ≤5m → CVD 14, Vol Avg 20, Cooldown 6
- ≤15m → CVD 12, Vol Avg 18, Cooldown 4
- ≤30m → CVD 10, Vol Avg 14, Cooldown 3
- 1H+ → CVD 10, Vol Avg 14, Cooldown 2
━━━━━━━━━━━━━━━━━━━━
STATS TABLE (LIVE VALUES)
━━━━━━━━━━━━━━━━━━━━
Displays on each bar close:
- Market Bias (BULL / BEAR / MIXED) — price vs VWAP + CVD direction
- VWAP price level
- σ-Distance — how many standard deviations price sits from VWAP
- Δ VWAP % — percentage distance from VWAP
- CVD — cumulative delta value and direction
- CVD Slope — momentum reading
- CVD Acceleration — building vs flat
- Volume Ratio — current bar vs average
- Bar Delta — raw buying/selling pressure for current bar
━━━━━━━━━━━━━━━━━━━━
WHY COMBINE VWAP + ORDER FLOW
━━━━━━━━━━━━━━━━━━━━
VWAP alone shows price location relative to fair value but gives no information about whether participants are genuinely committed to that location. Order flow (delta + CVD) fills that gap — a VWAP reclaim with collapsing CVD is a trap; a reclaim with accelerating CVD is institutional commitment. Combining both removes a large class of false signals that either method produces in isolation.
━━━━━━━━━━━━━━━━━━━━
WHAT'S ORIGINAL
━━━━━━━━━━━━━━━━━━━━
- Manually computed anchored VWAP + σ bands (not ta.vwap — gives full anchor control)
- Bar delta estimated from OHLCV (no tick feed required, works on all symbols)
- CVD resets per session anchor (not a rolling window — avoids stale accumulation)
- Three signal types with independent logic, filters, and cooldowns
- Adaptive lengths per timeframe (not fixed parameters)
- Bias label shows real-time VWAP + CVD confluence reading
━━━━━━━━━━━━━━━━━━━━
HOW TO USE
━━━━━━━━━━━━━━━━━━━━
Signals (triangle markers) appear below/above bars on confirmed closes only — no repainting.
- Triangle up (lime) = Long signal (A or B)
- Triangle down (red) = Short signal (A or B)
- Diamond (aqua) = Bullish CVD divergence (C)
- Diamond (orange) = Bearish CVD divergence (C)
Bar colors: teal = net buying pressure, red = net selling pressure. Intensity scales with delta strength.
Bias label (right of last bar) shows current market alignment: BULL = price above VWAP + CVD rising. BEAR = price below VWAP + CVD falling. MIXED = conflicting.
━━━━━━━━━━━━━━━━━━━━
RECOMMENDED USE
━━━━━━━━━━━━━━━━━━━━
- Best timeframes: 1m–15m for scalping, 30m–1H for intraday
- Forex / Gold: keep session filter OFF (24h market)
- Equities / Futures: enable session filter (open 90min + close 60min)
- Volume confirmation recommended ON for liquid instruments
- Use Signal C (divergence) as early warning; confirm with A or B before entry
━━━━━━━━━━━━━━━━━━━━
No repainting. No lookahead bias. All signals fire on barstate.isconfirmed only. CVD pivot divergence is inherently lagged by pivot length — this is intentional.
Script de código abierto
Fiel al espíritu de TradingView, el creador de este script lo ha convertido en código abierto, para que los traders puedan revisar y verificar su funcionalidad. ¡Enhorabuena al autor! Aunque puede utilizarlo de forma gratuita, recuerde que cualquier republicación del código está sujeta a nuestras Normas internas.

Exención de responsabilidad
La información y las publicaciones no constituyen, ni deben considerarse como, asesoramiento o recomendaciones financieras, de inversión, de trading u otro tipo, proporcionadas o respaldadas por TradingView. Obtenga más información en Condiciones de uso.
Script de código abierto
Fiel al espíritu de TradingView, el creador de este script lo ha convertido en código abierto, para que los traders puedan revisar y verificar su funcionalidad. ¡Enhorabuena al autor! Aunque puede utilizarlo de forma gratuita, recuerde que cualquier republicación del código está sujeta a nuestras Normas internas.
Exención de responsabilidad
La información y las publicaciones no constituyen, ni deben considerarse como, asesoramiento o recomendaciones financieras, de inversión, de trading u otro tipo, proporcionadas o respaldadas por TradingView. Obtenga más información en Condiciones de uso.