OPEN-SOURCE SCRIPT
Actualizado Technofunda
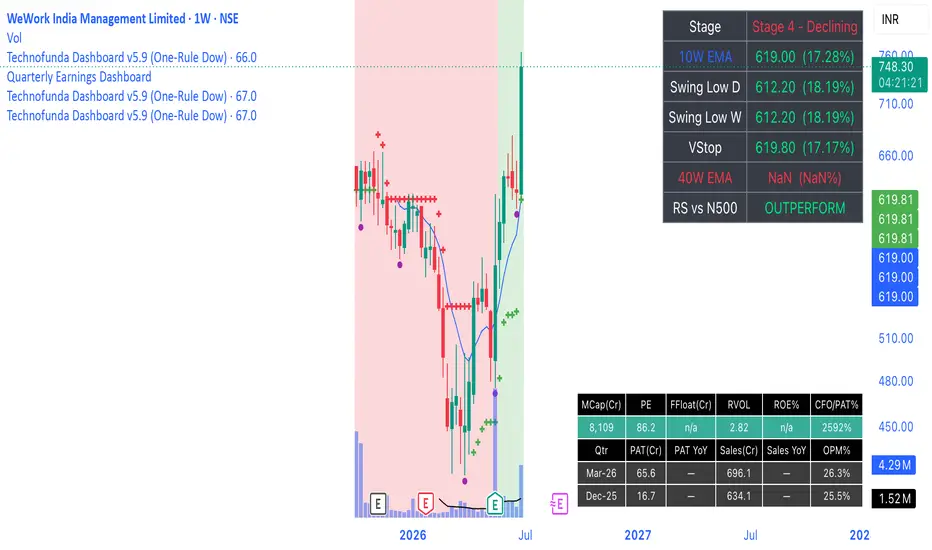
Here's what the **Technofunda Dashboard** indicator does, feature by feature:
**1. VStop (Volatility Stop) — feature 1**
ATR(20) × 2 trailing stop, plotted as dots that track price: green dots below the candles when the trend is positive (LONG), red dots above when negative (SHORT). It flips when price crosses the stop. Built with na-safe guards so it computes correctly from the start.
**2. Auto-switching moving averages — feature 5**
The indicator detects your timeframe automatically: on a daily chart it shows 21 / 50 / 200 **SMA**; on a weekly chart it switches to 10 / 20 / 40 **EMA**. Three lines — fast (aqua), medium (orange), trend (fuchsia).
**3. Distance from the MAs — feature 2**
A table (top-right) shows how far price is from each MA, measured down from price to the MA as a % of price — positive when above, negative when below, colour-coded green/red.
**4. Weinstein Stage — feature 3**
Classifies the stock into Stage 1 (Basing), 2 (Advancing), 3 (Topping) or 4 (Declining) using the long-term MA (200 DMA / 40W EMA) and its slope: price above + MA rising = Stage 2, etc. Shown in the table, colour-coded.
**5. 52-week high / low — feature 4**
Green triangle above a bar that makes a new 52-week high, red triangle below a bar that makes a new 52-week low (252 bars on daily, 52 on weekly). The table also shows current distance to the 52W high and low.
**6. Relative strength vs Nifty 500 — feature 6**
Compares the stock to a benchmark (default `NSE:CNX500`) over a lookback window. The chart background tints light green when outperforming, light red when underperforming, and the table shows OUTPERFORM / UNDERPERFORM.
**7. Per-candle letter states — feature 7**
Each candle is tagged with one letter based on its live condition:
- **A** — VStop positive (baseline / just flipped up)
- **B** — positive *and* beating Nifty 500 by ≥5%
- **C** — positive *and* beating Nifty 500 by ≥10%
- **X** — VStop negative (baseline)
- **Y** — negative *and* price below the medium MA (20W EMA / 50 DMA)
- **Z** — negative *and* price below the slow MA (40W EMA / 200 DMA)
Higher tiers win (a stock up 12% shows C, not A+B+C; one below the 40W EMA shows Z, not X+Y). The 5% / 10% thresholds are adjustable inputs.
**Extras**
A summary table consolidating MA distances, Stage, VStop status, RS status and 52W proximity; alerts for VStop flips and new 52-week highs/lows; and editable inputs for ATR length/multiplier, benchmark symbol, RS lookback, B/C thresholds, and MA slope length.
**1. VStop (Volatility Stop) — feature 1**
ATR(20) × 2 trailing stop, plotted as dots that track price: green dots below the candles when the trend is positive (LONG), red dots above when negative (SHORT). It flips when price crosses the stop. Built with na-safe guards so it computes correctly from the start.
**2. Auto-switching moving averages — feature 5**
The indicator detects your timeframe automatically: on a daily chart it shows 21 / 50 / 200 **SMA**; on a weekly chart it switches to 10 / 20 / 40 **EMA**. Three lines — fast (aqua), medium (orange), trend (fuchsia).
**3. Distance from the MAs — feature 2**
A table (top-right) shows how far price is from each MA, measured down from price to the MA as a % of price — positive when above, negative when below, colour-coded green/red.
**4. Weinstein Stage — feature 3**
Classifies the stock into Stage 1 (Basing), 2 (Advancing), 3 (Topping) or 4 (Declining) using the long-term MA (200 DMA / 40W EMA) and its slope: price above + MA rising = Stage 2, etc. Shown in the table, colour-coded.
**5. 52-week high / low — feature 4**
Green triangle above a bar that makes a new 52-week high, red triangle below a bar that makes a new 52-week low (252 bars on daily, 52 on weekly). The table also shows current distance to the 52W high and low.
**6. Relative strength vs Nifty 500 — feature 6**
Compares the stock to a benchmark (default `NSE:CNX500`) over a lookback window. The chart background tints light green when outperforming, light red when underperforming, and the table shows OUTPERFORM / UNDERPERFORM.
**7. Per-candle letter states — feature 7**
Each candle is tagged with one letter based on its live condition:
- **A** — VStop positive (baseline / just flipped up)
- **B** — positive *and* beating Nifty 500 by ≥5%
- **C** — positive *and* beating Nifty 500 by ≥10%
- **X** — VStop negative (baseline)
- **Y** — negative *and* price below the medium MA (20W EMA / 50 DMA)
- **Z** — negative *and* price below the slow MA (40W EMA / 200 DMA)
Higher tiers win (a stock up 12% shows C, not A+B+C; one below the 40W EMA shows Z, not X+Y). The 5% / 10% thresholds are adjustable inputs.
**Extras**
A summary table consolidating MA distances, Stage, VStop status, RS status and 52W proximity; alerts for VStop flips and new 52-week highs/lows; and editable inputs for ATR length/multiplier, benchmark symbol, RS lookback, B/C thresholds, and MA slope length.
Notas de prensa
naNotas de prensa
naNotas de prensa
naScript de código abierto
Fiel al espíritu de TradingView, el creador de este script lo ha convertido en código abierto, para que los traders puedan revisar y verificar su funcionalidad. ¡Enhorabuena al autor! Aunque puede utilizarlo de forma gratuita, recuerde que cualquier republicación del código está sujeta a nuestras Normas internas.

Exención de responsabilidad
La información y las publicaciones no constituyen, ni deben considerarse como, asesoramiento o recomendaciones financieras, de inversión, de trading u otro tipo, proporcionadas o respaldadas por TradingView. Obtenga más información en Condiciones de uso.
Script de código abierto
Fiel al espíritu de TradingView, el creador de este script lo ha convertido en código abierto, para que los traders puedan revisar y verificar su funcionalidad. ¡Enhorabuena al autor! Aunque puede utilizarlo de forma gratuita, recuerde que cualquier republicación del código está sujeta a nuestras Normas internas.
Exención de responsabilidad
La información y las publicaciones no constituyen, ni deben considerarse como, asesoramiento o recomendaciones financieras, de inversión, de trading u otro tipo, proporcionadas o respaldadas por TradingView. Obtenga más información en Condiciones de uso.