OPEN-SOURCE SCRIPT
Quarterly Earnings
Here's a ready-to-paste TradingView publication description:
---
**Quarterly Earnings Dashboard**
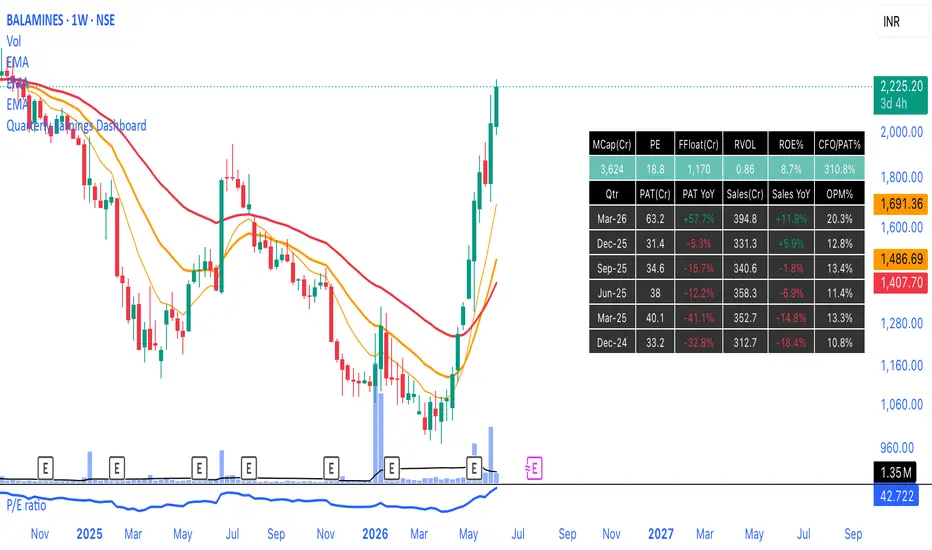
A clean on-chart table that puts a stock's key fundamentals next to its price action — built for fundamentals-aware swing/position traders who want valuation, quality, and earnings trend in one glance without leaving the chart.
**Current snapshot (top row)**
- **MCap (Cr)** — market capitalisation
- **PE** — price-to-earnings
- **FFloat (Cr)** — free-float market cap (MCap × float shares ÷ total shares)
- **RVOL** — relative volume vs the N-bar average (configurable), to spot unusual activity
- **ROE%** — return on equity
- **CFO/PAT%** — cash conversion: operating cash flow ÷ profit after tax. ~100%+ signals profits backed by real cash; persistently low is a quality red flag.
**Quarterly earnings table**
For the last N reported quarters: **PAT (Cr)**, **PAT YoY%**, **Sales (Cr)**, **Sales YoY%**, and **OPM%**. YoY columns are colour-coded green/red so accelerating or decelerating earnings jump out.
**Inputs**
- Quarters to show (1–16)
- Reporting period (FQ / FY / TTM)
- RVOL length
- Table position and colours
**Notes**
- All data is pulled from TradingView's built-in fundamentals via `request.financial()`. Best used on a single stock's weekly or daily chart.
- Some IDs (free float, cash flow) aren't published on the quarterly feed for every market, so the snapshot falls back FQ → FY → TTM. If a cell still reads "n/a", TradingView simply doesn't carry that data for the symbol.
- RVOL is relative to the chart timeframe — on a weekly chart it's volume vs the 20-week average.
Not financial advice; for research and educational use.
---
---
**Quarterly Earnings Dashboard**
A clean on-chart table that puts a stock's key fundamentals next to its price action — built for fundamentals-aware swing/position traders who want valuation, quality, and earnings trend in one glance without leaving the chart.
**Current snapshot (top row)**
- **MCap (Cr)** — market capitalisation
- **PE** — price-to-earnings
- **FFloat (Cr)** — free-float market cap (MCap × float shares ÷ total shares)
- **RVOL** — relative volume vs the N-bar average (configurable), to spot unusual activity
- **ROE%** — return on equity
- **CFO/PAT%** — cash conversion: operating cash flow ÷ profit after tax. ~100%+ signals profits backed by real cash; persistently low is a quality red flag.
**Quarterly earnings table**
For the last N reported quarters: **PAT (Cr)**, **PAT YoY%**, **Sales (Cr)**, **Sales YoY%**, and **OPM%**. YoY columns are colour-coded green/red so accelerating or decelerating earnings jump out.
**Inputs**
- Quarters to show (1–16)
- Reporting period (FQ / FY / TTM)
- RVOL length
- Table position and colours
**Notes**
- All data is pulled from TradingView's built-in fundamentals via `request.financial()`. Best used on a single stock's weekly or daily chart.
- Some IDs (free float, cash flow) aren't published on the quarterly feed for every market, so the snapshot falls back FQ → FY → TTM. If a cell still reads "n/a", TradingView simply doesn't carry that data for the symbol.
- RVOL is relative to the chart timeframe — on a weekly chart it's volume vs the 20-week average.
Not financial advice; for research and educational use.
---
Script de código abierto
Fiel al espíritu de TradingView, el creador de este script lo ha convertido en código abierto, para que los traders puedan revisar y verificar su funcionalidad. ¡Enhorabuena al autor! Aunque puede utilizarlo de forma gratuita, recuerde que cualquier republicación del código está sujeta a nuestras Normas internas.

Exención de responsabilidad
La información y las publicaciones no constituyen, ni deben considerarse como, asesoramiento o recomendaciones financieras, de inversión, de trading u otro tipo, proporcionadas o respaldadas por TradingView. Obtenga más información en Condiciones de uso.
Script de código abierto
Fiel al espíritu de TradingView, el creador de este script lo ha convertido en código abierto, para que los traders puedan revisar y verificar su funcionalidad. ¡Enhorabuena al autor! Aunque puede utilizarlo de forma gratuita, recuerde que cualquier republicación del código está sujeta a nuestras Normas internas.
Exención de responsabilidad
La información y las publicaciones no constituyen, ni deben considerarse como, asesoramiento o recomendaciones financieras, de inversión, de trading u otro tipo, proporcionadas o respaldadas por TradingView. Obtenga más información en Condiciones de uso.