OPEN-SOURCE SCRIPT
Actualizado AG Pro Equal High / Equal Low Sweep Engine [AGPro Series]
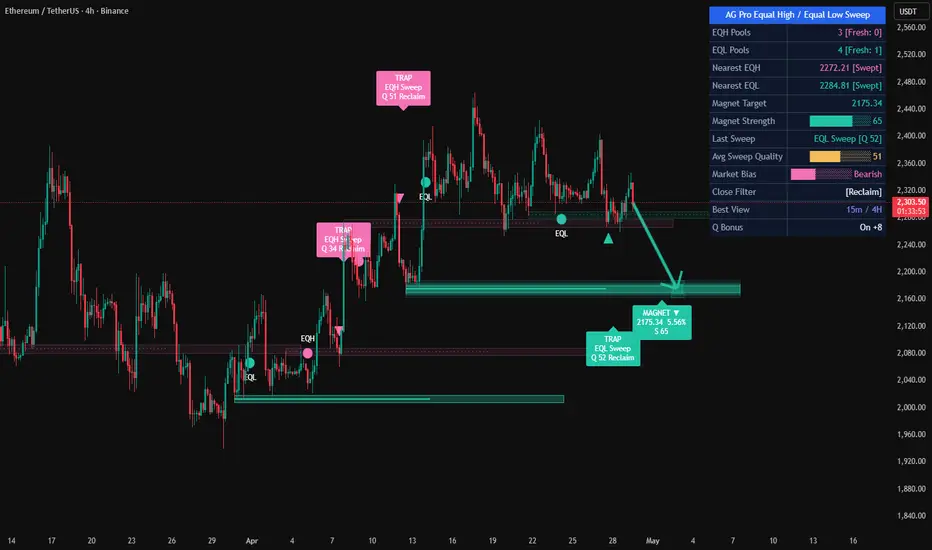
AG Pro Equal High / Equal Low Sweep Engine [AGPro Series]
Overview / What it does
AG Pro Equal High / Equal Low Sweep Engine is a price-action overlay designed to detect equal highs (EQH) and equal lows (EQL), track the liquidity pools that form around those levels, and highlight sweep events when price briefly trades through them and then closes back with confirmation. The script focuses on one specific market behavior: clustered highs and lows that tend to attract liquidity, followed by rejection-style sweeps that can mark failed continuation attempts, trap conditions, or local reaction points.
Instead of treating every wick through a prior level as equally important, the script separates untouched pools from already swept pools, applies a configurable tolerance model for defining EQH/EQL structures, and adds close-based confirmation logic so users can filter out weaker events. Short liquidity lines, band-style zones, trap labels, and a compact summary panel are used to keep the information visible without turning the chart into a large box-based map.
This tool is built for traders who want a structured view of repeated highs/lows and the liquidity behavior around them. It is not intended to label every possible swing event on the chart. Its purpose is narrower and more deliberate: identify equal-high / equal-low liquidity pools, monitor whether they remain intact or get swept, and display the sweep in a visually organized way.
Unique Edge
The main distinction of this script is that it does not attempt to map all forms of stop runs or all types of liquidity events. It concentrates specifically on EQH/EQL liquidity pools and the sweep lifecycle around those pools. That narrower scope allows the chart objects to remain more readable while still showing useful structure.
The script also distinguishes between untouched and swept states. This matters because a fresh liquidity pool and a previously swept pool do not represent the same chart condition. Untouched pools can still act as active draw-on-liquidity zones, while swept pools become part of recent context and may be interpreted differently depending on the user's framework.
A second differentiator is the combination of equal-pool detection, close confirmation, and optional quality scoring. Equal highs and equal lows are first identified using pivot logic and a user-defined tolerance percentage. Then, when price trades through the pool, the script can require either any wick, a reclaim close, or a stronger rejection close before confirming the sweep. An optional quality bonus can further weight events when relative volume and rejection characteristics are more supportive.
The visual model is also intentionally selective. Instead of using large generalized rectangles across the whole chart, the script uses shorter liquidity lines and band zones tied directly to the detected pool. This keeps the visuals anchored to the detected structure rather than creating broad areas that may overstate precision.
Methodology
1) Equal High / Equal Low Detection
The script uses pivot highs and pivot lows to build candidate swing points. When two highs or two lows form within the user-defined tolerance threshold and within the required bar spacing, they are treated as an equal-high or equal-low liquidity pool. Multiple nearby pools can optionally be merged into a cleaner combined structure.
2) Liquidity Pool Lifecycle
Once a pool is created, it is tracked as active until one of two things happens: it is swept by price, or it expires after its configured lifetime. The script maintains state so pools can be shown as untouched, swept, or removed when they are no longer relevant.
3) Sweep Confirmation
A sweep is not limited to price piercing the level. The script can require:
- Any Wick: any trade-through qualifies.
- Reclaim Close: price must close back through the level after the sweep.
- Strong Rejection: a stricter close-position filter is applied.
This helps users decide how sensitive or selective they want the engine to be.
4) Quality Logic
When enabled, the script calculates a quality score using rejection characteristics, close position, relative volume behavior, pool freshness, and pivot clustering. This is not a predictive score or a probability model. It is a contextual ranking layer intended to help compare sweeps on the same chart.
5) Visual Presentation
The script can draw:
- short horizontal liquidity lines
- band-style EQH/EQL zones
- optional reaction boxes after selected sweeps
- trap labels on confirmed events
- a summary panel showing current pool and sweep status
Signals & Alerts
The script includes alert conditions for:
- new EQH pool detected
- new EQL pool detected
- EQH sweep confirmed
- EQL sweep confirmed
- any sweep confirmed
These alerts are event-based and depend on the current settings used for confirmation and filtering. If stricter filters are selected, the number of confirmed events will naturally decrease.
Key Inputs
Pivot Strength
Controls how swing highs and lows are confirmed. Higher values usually produce fewer, more structurally significant pools.
EQH / EQL Tolerance %
Defines how close two highs or lows must be to qualify as equal. Lower values make the script stricter. Higher values allow broader matching.
Min / Max Bars Between Pivots
Controls the acceptable spacing between the two pivots that define a pool.
Sweep Close Filter
Lets the user choose between wick-only behavior and more selective reclaim/rejection confirmation.
Quality Bonus
Adds an optional scoring bonus when the sweep also shows stronger contextual characteristics.
Liquidity Line / Zone Length
Controls how far the liquidity structures extend on the chart.
Panel and Visual Settings
Allow the user to tune panel position, label size, color theme, and display density for different chart styles and timeframes.
Limitations & Transparency
This script identifies equal highs and equal lows using pivot-based rules and a configurable tolerance model. Because of that, results depend on the chosen settings, the symbol, the timeframe, and the chart's volatility profile.
A confirmed sweep should not be interpreted as a guaranteed reversal or a complete trade setup by itself. In some market conditions, price can sweep a pool and continue in the same direction. In other conditions, a sweep may mark only a short-lived reaction. The script highlights structural events; it does not forecast outcome.
The quality score is a contextual ranking aid, not a performance promise, win-rate estimate, or statistical edge claim. Different users may prefer different thresholds depending on market regime and execution model.
Band zones and reaction areas are visual approximations derived from the detected pool and post-sweep behavior. They are designed to improve chart readability, not to define exact institutional order blocks or guaranteed execution zones.
Risk Disclosure
This script is an analytical charting tool for studying equal-high / equal-low liquidity behavior and sweep confirmation. It does not provide financial advice, investment advice, or trade recommendations. All trading decisions remain the user's responsibility.
Like any technical tool, it should be used with broader market context, risk management, and independent judgment. No indicator can eliminate uncertainty, and past chart behavior does not guarantee future results.
Overview / What it does
AG Pro Equal High / Equal Low Sweep Engine is a price-action overlay designed to detect equal highs (EQH) and equal lows (EQL), track the liquidity pools that form around those levels, and highlight sweep events when price briefly trades through them and then closes back with confirmation. The script focuses on one specific market behavior: clustered highs and lows that tend to attract liquidity, followed by rejection-style sweeps that can mark failed continuation attempts, trap conditions, or local reaction points.
Instead of treating every wick through a prior level as equally important, the script separates untouched pools from already swept pools, applies a configurable tolerance model for defining EQH/EQL structures, and adds close-based confirmation logic so users can filter out weaker events. Short liquidity lines, band-style zones, trap labels, and a compact summary panel are used to keep the information visible without turning the chart into a large box-based map.
This tool is built for traders who want a structured view of repeated highs/lows and the liquidity behavior around them. It is not intended to label every possible swing event on the chart. Its purpose is narrower and more deliberate: identify equal-high / equal-low liquidity pools, monitor whether they remain intact or get swept, and display the sweep in a visually organized way.
Unique Edge
The main distinction of this script is that it does not attempt to map all forms of stop runs or all types of liquidity events. It concentrates specifically on EQH/EQL liquidity pools and the sweep lifecycle around those pools. That narrower scope allows the chart objects to remain more readable while still showing useful structure.
The script also distinguishes between untouched and swept states. This matters because a fresh liquidity pool and a previously swept pool do not represent the same chart condition. Untouched pools can still act as active draw-on-liquidity zones, while swept pools become part of recent context and may be interpreted differently depending on the user's framework.
A second differentiator is the combination of equal-pool detection, close confirmation, and optional quality scoring. Equal highs and equal lows are first identified using pivot logic and a user-defined tolerance percentage. Then, when price trades through the pool, the script can require either any wick, a reclaim close, or a stronger rejection close before confirming the sweep. An optional quality bonus can further weight events when relative volume and rejection characteristics are more supportive.
The visual model is also intentionally selective. Instead of using large generalized rectangles across the whole chart, the script uses shorter liquidity lines and band zones tied directly to the detected pool. This keeps the visuals anchored to the detected structure rather than creating broad areas that may overstate precision.
Methodology
1) Equal High / Equal Low Detection
The script uses pivot highs and pivot lows to build candidate swing points. When two highs or two lows form within the user-defined tolerance threshold and within the required bar spacing, they are treated as an equal-high or equal-low liquidity pool. Multiple nearby pools can optionally be merged into a cleaner combined structure.
2) Liquidity Pool Lifecycle
Once a pool is created, it is tracked as active until one of two things happens: it is swept by price, or it expires after its configured lifetime. The script maintains state so pools can be shown as untouched, swept, or removed when they are no longer relevant.
3) Sweep Confirmation
A sweep is not limited to price piercing the level. The script can require:
- Any Wick: any trade-through qualifies.
- Reclaim Close: price must close back through the level after the sweep.
- Strong Rejection: a stricter close-position filter is applied.
This helps users decide how sensitive or selective they want the engine to be.
4) Quality Logic
When enabled, the script calculates a quality score using rejection characteristics, close position, relative volume behavior, pool freshness, and pivot clustering. This is not a predictive score or a probability model. It is a contextual ranking layer intended to help compare sweeps on the same chart.
5) Visual Presentation
The script can draw:
- short horizontal liquidity lines
- band-style EQH/EQL zones
- optional reaction boxes after selected sweeps
- trap labels on confirmed events
- a summary panel showing current pool and sweep status
Signals & Alerts
The script includes alert conditions for:
- new EQH pool detected
- new EQL pool detected
- EQH sweep confirmed
- EQL sweep confirmed
- any sweep confirmed
These alerts are event-based and depend on the current settings used for confirmation and filtering. If stricter filters are selected, the number of confirmed events will naturally decrease.
Key Inputs
Pivot Strength
Controls how swing highs and lows are confirmed. Higher values usually produce fewer, more structurally significant pools.
EQH / EQL Tolerance %
Defines how close two highs or lows must be to qualify as equal. Lower values make the script stricter. Higher values allow broader matching.
Min / Max Bars Between Pivots
Controls the acceptable spacing between the two pivots that define a pool.
Sweep Close Filter
Lets the user choose between wick-only behavior and more selective reclaim/rejection confirmation.
Quality Bonus
Adds an optional scoring bonus when the sweep also shows stronger contextual characteristics.
Liquidity Line / Zone Length
Controls how far the liquidity structures extend on the chart.
Panel and Visual Settings
Allow the user to tune panel position, label size, color theme, and display density for different chart styles and timeframes.
Limitations & Transparency
This script identifies equal highs and equal lows using pivot-based rules and a configurable tolerance model. Because of that, results depend on the chosen settings, the symbol, the timeframe, and the chart's volatility profile.
A confirmed sweep should not be interpreted as a guaranteed reversal or a complete trade setup by itself. In some market conditions, price can sweep a pool and continue in the same direction. In other conditions, a sweep may mark only a short-lived reaction. The script highlights structural events; it does not forecast outcome.
The quality score is a contextual ranking aid, not a performance promise, win-rate estimate, or statistical edge claim. Different users may prefer different thresholds depending on market regime and execution model.
Band zones and reaction areas are visual approximations derived from the detected pool and post-sweep behavior. They are designed to improve chart readability, not to define exact institutional order blocks or guaranteed execution zones.
Risk Disclosure
This script is an analytical charting tool for studying equal-high / equal-low liquidity behavior and sweep confirmation. It does not provide financial advice, investment advice, or trade recommendations. All trading decisions remain the user's responsibility.
Like any technical tool, it should be used with broader market context, risk management, and independent judgment. No indicator can eliminate uncertainty, and past chart behavior does not guarantee future results.
Notas de prensa
UPDATE NOTES - V1.1This update refines the visual structure, state clarity, and publication quality of AG Pro Equal High / Equal Low Sweep Engine [AGPro Series].
The script continues to focus on a straightforward objective: detecting equal high and equal low liquidity pools, monitoring whether those pools remain fresh or become swept, and highlighting reclaim-style sweep behavior when price pushes through a pool and then closes back through it according to the selected confirmation rule.
This release does not reposition the script as a forecasting model, a standalone decision system, or an automated execution framework. Its role remains analytical. The purpose of the update is to make liquidity pool structure easier to read, easier to monitor, and more consistent with the current AG Pro visual standard used for public-facing open-source publications.
What changed
• Standardized the summary panel header into a single merged top row.
• Applied the fixed blue header style to the first panel row for a cleaner and more consistent AG Pro presentation.
• Reduced the default panel text size to Small so the panel occupies space more efficiently in publication mode.
• Kept label text at a Normal default so sweep events remain legible without requiring aggressive zoom.
• Expanded the liquidity presentation beyond simple short lines by introducing a band-style visual layer alongside the core pool line structure.
• Improved the distinction between fresh liquidity areas and already-swept areas so the chart communicates pool lifecycle more clearly at first glance.
• Refined trap label formatting so confirmed sweep events display in a more structured way, including quality score context and reclaim wording.
• Upgraded the panel readout to show pool totals, fresh counts, nearest EQH and EQL references, most recent sweep context, close-filter mode, zone mode, and quality-bonus status.
• Tightened the overall chart presentation so the script looks cleaner and more publication-ready while still preserving the underlying equal-liquidity engine.
Why this update matters
Equal highs and equal lows are often discussed in a generic way, but chart usability depends heavily on how those zones are stored, visualized, and kept readable over time. In earlier presentation states, the script logic could still work correctly while the chart itself felt more basic than desired for a polished public release. This update addresses that gap.
The revised display is intended to make it easier to separate three different ideas that matter in liquidity-based chart reading:
1. Where clustered equal liquidity exists.
2. Whether that liquidity is still fresh or has already been interacted with.
3. Whether the most recent interaction produced a reclaim-style sweep that deserves attention.
By improving those visual distinctions, the script can now function more effectively as a chart-organization tool instead of appearing as a minimal detector with raw markers only.
Panel improvements
The summary panel has been rebuilt around the current AG Pro publication standard. The first row is now a single merged header with the script name only. This keeps the top line visually disciplined and removes unnecessary clutter.
The rest of the panel is structured to provide compact, functional context rather than decorative noise. Users can now review EQH and EQL pool totals, quickly identify how many of those pools are still fresh, inspect the nearest active reference levels, and monitor the latest confirmed sweep event together with its quality value. This makes the panel more useful for fast chart review while remaining compact enough for public screenshots and published chart layouts.
Visual changes on the chart
This release also improves how liquidity structures appear directly on price. Instead of relying on a basic line-only impression, the script now presents pool areas with a more intentional band-and-line treatment. That change helps the zones read more like actual liquidity regions instead of isolated static references.
Sweep labels were also reformatted for stronger readability. Confirmed trap events now communicate the direction of the sweep and the associated quality reading in a cleaner hierarchy. The goal is not to add noise, but to make meaningful events more noticeable when a chart is reviewed after the fact or when a user scans multiple recent swings quickly.
Bar coloring and sweep-state visualization continue to support fast recognition of confirmed events, but the overall display has been tuned to look more professional and less raw in publish mode.
Logic and workflow context
The core purpose of the script remains unchanged. It is still centered on:
• detecting equal high and equal low liquidity pools from pivot structure,
• grouping nearby pools when applicable,
• evaluating whether a pool has been swept,
• applying the selected close filter,
• assigning a quality score,
• and surfacing the result visually on the chart and in alerts.
What changed in this update is not the fundamental identity of the tool, but the quality of its presentation and the clarity of its state reporting. In practical terms, users should now find it easier to keep track of untouched liquidity, recent sweeps, and the current visual hierarchy of relevant zones.
Transparency
This script remains a chart-analysis tool. It does not guarantee reversals, continuations, or reaction quality after a sweep. Equal liquidity can remain in place longer than expected, and not every sweep will lead to meaningful follow-through. Quality scoring is a structured internal ranking aid, not a certainty model.
The script should still be used with broader chart context, including structure, volatility, and instrument behavior. The update improves readability and presentation, but it does not remove the need for interpretation.
Risk disclosure
This script is provided for market analysis and educational use. It does not provide financial advice, does not guarantee outcomes, and should not be treated as an automated trading system. Any decision based on liquidity behavior, sweep behavior, reclaim behavior, or quality scoring remains the responsibility of the user.
Notas de prensa
v1.5 — Final readability polish- Label vertical clearance strengthened:
- Recent-range multiplier increased from 1.5x to 1.8x
- Labels now clear the candle body with a visible margin across all
timeframes, including low-volatility 4H and daily charts
- Cleaner same-bar visuals:
- When a new liquidity pool forms and is swept on the same bar, the
small pool marker (circle + EQH/EQL text) is hidden so it doesn't
overlap the sweep label
- Sweep detection, alerts and panel state remain fully active
- Anti-clash window widened:
- Default increased from 12 to 20 bars
- Consecutive sweeps within a cluster now stack more aggressively,
preventing labels from visually colliding
No changes to detection logic, sweep confirmation, quality scoring,
alerts or any signal-affecting default. This is the final visual
polish pass in the v1.x series.
Notas de prensa
v1.7 — Ground-Up Visual & Intelligence UpgradeThis is a major refresh of the script's visual layer and scoring engine.
Every active pool is now ranked live, the strongest one is projected
onto the chart, and the summary panel has been rebuilt with inline
progress bars for instant readability.
■ NEW — Liquidity Strength Score
Every active pool is scored from 0 to 100 using four weighted
components: pivot cluster density, freshness, ATR-normalized clarity
and proximity to current price. All four weights are adjustable.
■ NEW — Magnet Projection
The strongest unswept pool above the Magnet threshold is drawn as a
directional arrow from current price to the target level, with a
pulsing halo at the destination. The projection label reports exact
price, percentage distance and live strength score.
■ NEW — Strength Halo
Institutional-grade pools (default S ≥ 60) receive a three-layer glow
ring so the most meaningful liquidity is visible at a glance, without
scanning numbers.
■ NEW — Panel Mini Bars
Magnet Strength, Avg Sweep Quality and Market Bias now render as
10-cell Unicode progress bars with color-coded states (bullish / bearish
/ neutral). The summary panel now has 11 data rows under the header.
■ IMPROVED — Gradient Fade By Age
Fresh pools render bright, older pools gradually fade. The opacity
range was widened (65 → 95) so the hierarchy between recent and old
liquidity is immediately visible.
■ IMPROVED — Market Bias & Avg Sweep Quality
Both metrics are now tracked across a rolling 20-sweep window and
translated into live panel rows.
■ CLEANUP
Color theme consolidated to the AGPro official palette. Code paths
optimized and redundant computations removed.
No input migration is required. Existing alerts continue to work.
Notas de prensa
v1.7.2 — Visual polish• Magnet projection default length reduced from 30 to 20 bars so the
target label no longer overlaps the summary panel on standard
screen sizes.
• Magnet label is now anchored slightly left of the target halo,
keeping the full text visible inside the chart area.
• Users who want a longer projection can raise "Magnet Projection
Length" from the input panel.
No functional changes. No input migration required.
Notas de prensa
🔧 UPDATE NOTES - V1.8.6This update focuses on panel clarity and timeframe guidance.
The core purpose of the script remains unchanged.
Equal High / Equal Low Sweep Engine continues to map EQH / EQL liquidity pools, sweep behavior, reclaim context, strength scoring, and magnet projection.
This release adds a concise panel hint for the chart views where the visual system is designed to look strongest.
------------------------
What Changed
------------------------
• Added Best View panel row
The panel now includes a short Best View row showing 15m / 4H.
• Kept the message neutral
The wording avoids instruction-like language such as "use this timeframe" and instead presents a clean visual-context hint.
• Preserved the original panel identity
The first panel row remains a single merged blue AGPro title row, and the familiar EQH / EQL / Magnet / Market Bias layout is preserved.
• Kept 15m / 4H Visual Pacing
The script remains optimized for the 15-minute and 4-hour views without forcing all timeframes to look the same.
------------------------
Visual Improvements
------------------------
• The panel now communicates the intended best-view context at a glance.
• The added row is compact and does not change the chart engine.
• The script keeps its original TRAP label language, EQH / EQL markers, strength halos, magnet projection, and premium panel style.
------------------------
Interface & Usability
------------------------
• Added Best View → 15m / 4H to the summary panel.
• Panel location, panel theme, panel font size, label font size, and panel show/hide controls remain available.
• Public title formatting remains compliant: no leading AG Pro prefix in the indicator title, while AG Pro remains in the short title and panel title.
------------------------
Behavior Notes
------------------------
This update does not change the analytical logic of the script.
The goal is to guide interpretation toward the timeframes where the visual system is most readable.
Users should interpret outputs as analytical context markers, not trade instructions.
------------------------
Limitations Reminder
------------------------
The script remains a rule-based analytical tool.
Some timeframes may naturally produce fewer equal high / equal low pools depending on volatility, liquidity, and available structure.
Outputs should always be interpreted within broader market context.
------------------------
Risk Reminder
------------------------
This script is for educational and analytical purposes only.
It does not provide financial advice or guaranteed trading outcomes.
Users remain responsible for their own decisions.
Script de código abierto
Fiel al espíritu de TradingView, el creador de este script lo ha convertido en código abierto, para que los traders puedan revisar y verificar su funcionalidad. ¡Enhorabuena al autor! Aunque puede utilizarlo de forma gratuita, recuerde que cualquier republicación del código está sujeta a nuestras Normas internas.

🧠 Trading Suite - Flagship Workflow
tradingview.com/script/XJmX3p98-Trading-Suite-AGPro-Series/
🔷 Crypto Setup Planner - Multi-Symbol Planner
tradingview.com/script/LgVRo7Ql-Crypto-Setup-Planner-AGPro-Series/
tradingview.com/script/XJmX3p98-Trading-Suite-AGPro-Series/
🔷 Crypto Setup Planner - Multi-Symbol Planner
tradingview.com/script/LgVRo7Ql-Crypto-Setup-Planner-AGPro-Series/
Exención de responsabilidad
La información y las publicaciones no constituyen, ni deben considerarse como, asesoramiento o recomendaciones financieras, de inversión, de trading u otro tipo, proporcionadas o respaldadas por TradingView. Obtenga más información en Condiciones de uso.
Script de código abierto
Fiel al espíritu de TradingView, el creador de este script lo ha convertido en código abierto, para que los traders puedan revisar y verificar su funcionalidad. ¡Enhorabuena al autor! Aunque puede utilizarlo de forma gratuita, recuerde que cualquier republicación del código está sujeta a nuestras Normas internas.
🧠 Trading Suite - Flagship Workflow
tradingview.com/script/XJmX3p98-Trading-Suite-AGPro-Series/
🔷 Crypto Setup Planner - Multi-Symbol Planner
tradingview.com/script/LgVRo7Ql-Crypto-Setup-Planner-AGPro-Series/
tradingview.com/script/XJmX3p98-Trading-Suite-AGPro-Series/
🔷 Crypto Setup Planner - Multi-Symbol Planner
tradingview.com/script/LgVRo7Ql-Crypto-Setup-Planner-AGPro-Series/
Exención de responsabilidad
La información y las publicaciones no constituyen, ni deben considerarse como, asesoramiento o recomendaciones financieras, de inversión, de trading u otro tipo, proporcionadas o respaldadas por TradingView. Obtenga más información en Condiciones de uso.