OPEN-SOURCE SCRIPT
Ichimoku Itto by [Itto-Ryu]
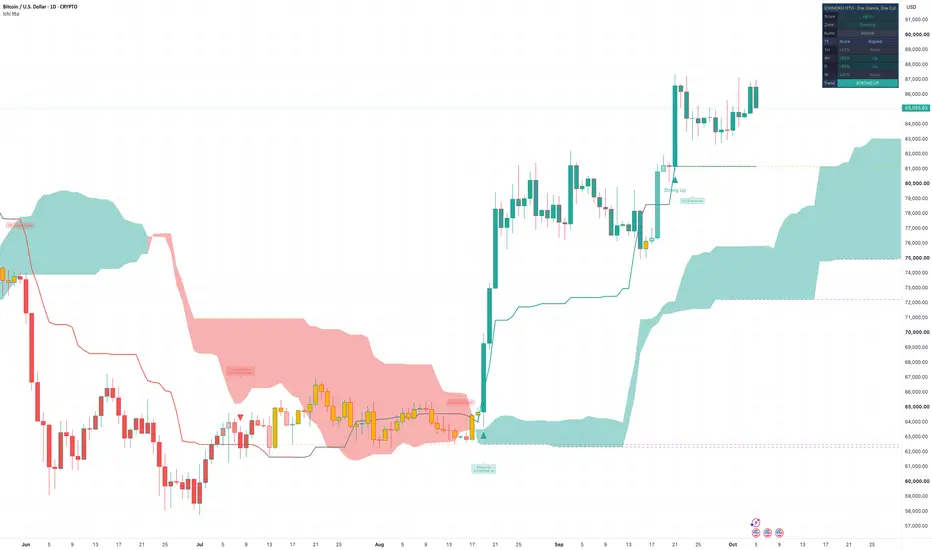
Ichimoku Itto ("one glance, one cut") is an Ichimoku Kinko Hyo tool built to be read at a glance. A standard Ichimoku chart draws five lines and leaves the interpretation to the reader. Itto keeps the classic math and adds a layer that turns those lines into one clear reading per bar.
This script is for technical education and chart study only. It is not financial advice and gives no buy or sell recommendation.
WHAT IS DIFFERENT FROM A STANDARD ICHIMOKU
1. One score instead of five lines to judge
The standard indicator shows Tenkan, Kijun, Chikou and the Kumo, and the reader checks each relationship by eye. Itto checks five relationships on every bar and adds them into one score from -100% to +100%, plus a plain trend label (STRONG UP … CHOP ZONE).
2. A built-in chop zone
Classic Ichimoku has no "no reading" state, so every crossing looks equally important. Itto marks a chop zone when price is inside the Kumo or the score is near zero. In that zone the Kijun turns gray, candles turn amber and no marks print.
3. Kijun slope as part of the reading
Most Ichimoku tools ignore whether the Kijun is rising, falling or flat. Itto scores the slope, so a flat Kijun lowers the reading even when price sits above the cloud.
4. A stricter Chikou test
The usual check compares Chikou with the close of the bar it is plotted against. Itto requires the close to clear the HIGH (or LOW) of that bar, so Chikou counts only when it is clear of price, not just touching it.
5. Equilibrium Magnets
In Ichimoku theory a flat Kijun or flat Senkou Span B marks a balance price that technicians watch as a magnet level. The standard indicator does not highlight these levels. Itto draws them automatically as dashed lines extended to the right.
6. Kumo thickness in words
The cloud's thickness is ranked against the last 252 bars and shown as Thin, Normal or Thick, instead of leaving the reader to judge it by eye.
7. Sanyaku in plain English
The classic "Sanyaku Koten / Gyakuten" (three signals agree) is labeled "3/3 Aligned Up / Down" and shown for four timeframes at once.
8. A multi-timeframe table that reads the same everywhere
Each timeframe row shows the latest closed bar of that timeframe, so the table gives the same answer on a 1H, 4H, D or W chart.
9. A cleaner chart by default
Only the Kijun ("the blade") and the Kumo are drawn by default. The blade is colored by the score and candles are colored by trend, so the reading is visible without the table. All other Ichimoku lines can be turned on.
HOW THE SCORE WORKS
Each check adds +1 (up), -1 (down) or 0 (neutral). Five checks give a score from -5 to +5, shown as -100% to +100% (each point = 20%).
1. Price vs the current Kumo: above = +1, below = -1, inside = 0
2. Tenkan vs Kijun: Tenkan above = +1, below = -1
3. Chikou: close above the high of the bar it is plotted against = +1, below that bar's low = -1, otherwise 0 (a stricter test than close-vs-close)
4. Future Kumo color: Senkou A above Senkou B = +1, below = -1
5. Kijun slope: Kijun higher than 5 bars ago = +1, lower = -1, flat = 0
Trend row in the dashboard:
• STRONG UP: +80% or more · UP: +60% · SIDEWAYS UP: +40%
• STRONG DOWN: -80% or less · DOWN: -60% · SIDEWAYS DOWN: -40%
• CHOP ZONE · NO ACTION: price inside the Kumo, or the score is between -20% and +20%. The chop zone overrides the score.
3/3 Aligned = checks 1, 2 and 3 all point the same way on the same bar. The label prints only on the first bar it becomes true.
Kumo thickness = the gap between Senkou A and B under the current bar, ranked against the last 252 bars: Thin (bottom 20%), Normal, Thick (top 20%). Technicians often treat a thick Kumo as a stronger support or resistance zone and a thin Kumo as easier to cross.
ON THE CHART
• Kijun "blade" line: green-to-red gradient by score, gray in the chop zone
• Kumo: shaded cloud, projected forward like the built-in Ichimoku (on by default)
• Tenkan, Chikou and the Senkou span lines: off by default, turn on under Lines
• ▲ Strong Up / ▼ Strong Down: score crossed the Strong threshold outside the chop zone
• 3/3 Aligned Up / Down labels: the three core signals agree
• Dashed orange line: Kijun magnet (Kijun flat for 8+ bars)
• Dashed purple line: Span B magnet (Senkou Span B flat for 8+ bars, drawn at its projected position)
• Candle colors: green / red / amber, or "Strength shades" (darker = stronger)
DASHBOARD
• Score: the chart's own timeframe, current bar
• Zone: Trending or Chop
• Kumo: Thin / Normal / Thick
• TF table (default 1H, 4H, D, W): score and 3/3 Aligned state for each timeframe
• Trend: the summary label described above
Important: every row in the TF table shows the latest CLOSED bar of that timeframe, so the table reads the same on any chart timeframe. The Score and Trend rows show the chart's current bar, which may still be forming. On a 1H chart, the Score row can therefore differ from the 1H row until the bar closes. Each timeframe has its own Kumo and lines, so a 1H reading and a D reading can point in different directions. That is normal. After switching timeframes the table needs a moment to load.
WHICH TIMEFRAME
Ichimoku was designed for the Daily chart. The Classic settings (9 / 26 / 52) match calendar spans on D: about 1.5 weeks, 1 month and 2 months of a 6-day trading week. For markets that trade 5 days a week there is a "5-Day Week" preset (7 / 22 / 44), and a "Crypto" preset (20 / 60 / 120) for 24/7 markets.
On intraday charts the same math works as plain bar counts, without the calendar meaning. Many technicians read D as the main chart and W as the bigger picture. The TF table shows both. No timeframe is claimed to be more accurate than another.
SETTINGS
Ichimoku
• Preset: Classic (default) / 5-Day Week / Crypto
• Kijun slope lookback: 5 bars
Signals
• Strong threshold: 4 (= 80%)
• Chop score band: 1 (= 20%)
• Show Strong Up / Down marks, Show 3/3 Aligned labels
Equilibrium Magnets
• Flat bars: 8 · Keep last: 6 lines (oldest deleted first)
Lines
• Tenkan, Chikou, Senkou spans (off), Kumo (on), Table (on) with size Tiny / Small / Normal / Large
• Color candles by trend (on): 3 colors or Strength shades
Colors: all line, cloud, candle and chop colors can be changed.
MTF table: four timeframes, default 60 / 240 / D / W.
ALERTS
Strong Up · Strong Down · Aligned Up · Aligned Down · Enter Chop · Exit Chop. All alerts fire on confirmed (closed) bars only.
WHO IT IS FOR
• Traders and students learning Ichimoku who want the five parts read in one place
• Chart readers who want a clear "chop / no reading" filter before studying a chart
Not for:
• Anyone looking for automatic entries, exits, targets or position sizing. The script draws none of these.
• Heikin Ashi, Renko or other non-standard chart types
COMMON MISTAKES
• Treating "Strong Up / Strong Down" as an instruction. It describes the Ichimoku state on a closed bar, nothing more.
• Ignoring the chop zone. Inside the Kumo the five checks often disagree and the score swings.
• Comparing the Score row with the same-timeframe row in the TF table on a forming bar (see Dashboard).
• Reading the projected Kumo as a forecast. It is plotted forward by design. It does not predict price.
DISCLOSURE
• Pine Script version: v6
• Open-source under the Mozilla Public License 2.0
• Repaint: NO for marks, labels, magnets and alerts, which are set only on confirmed bars. The Kijun color and candle colors on the live bar can change until that bar closes. The Kumo is plotted forward and the Chikou backward by the standard Ichimoku offsets. Plotted values do not change after a bar closes.
• Multi-timeframe: the TF table uses request.security and request.security_lower_tf to read the latest closed bar of each timeframe. It is shown on the last bar only and is not used for any mark, label or alert.
• Chart type: standard candles or bars only. Not for Heikin Ashi, Renko, Range, Kagi or Point & Figure.
• Original work: the score, chop zone, magnets and dashboard are the author's own logic built on the public Ichimoku Kinko Hyo method (Goichi Hosoda). No third-party code is reused.
Developed by Thiranat Ngamchitcharoen (Itto-Ryu).
DISCLAIMER
This indicator is published for educational and informational purposes only. It is not financial, investment or trading advice and does not recommend buying or selling any instrument. Signals and labels describe past and current chart conditions; they do not predict future prices. Past behavior of any indicator does not guarantee future results. Trading involves risk, including the loss of capital. You are solely responsible for your own decisions. Test any idea on your own data before relying on it.
This script is for technical education and chart study only. It is not financial advice and gives no buy or sell recommendation.
WHAT IS DIFFERENT FROM A STANDARD ICHIMOKU
1. One score instead of five lines to judge
The standard indicator shows Tenkan, Kijun, Chikou and the Kumo, and the reader checks each relationship by eye. Itto checks five relationships on every bar and adds them into one score from -100% to +100%, plus a plain trend label (STRONG UP … CHOP ZONE).
2. A built-in chop zone
Classic Ichimoku has no "no reading" state, so every crossing looks equally important. Itto marks a chop zone when price is inside the Kumo or the score is near zero. In that zone the Kijun turns gray, candles turn amber and no marks print.
3. Kijun slope as part of the reading
Most Ichimoku tools ignore whether the Kijun is rising, falling or flat. Itto scores the slope, so a flat Kijun lowers the reading even when price sits above the cloud.
4. A stricter Chikou test
The usual check compares Chikou with the close of the bar it is plotted against. Itto requires the close to clear the HIGH (or LOW) of that bar, so Chikou counts only when it is clear of price, not just touching it.
5. Equilibrium Magnets
In Ichimoku theory a flat Kijun or flat Senkou Span B marks a balance price that technicians watch as a magnet level. The standard indicator does not highlight these levels. Itto draws them automatically as dashed lines extended to the right.
6. Kumo thickness in words
The cloud's thickness is ranked against the last 252 bars and shown as Thin, Normal or Thick, instead of leaving the reader to judge it by eye.
7. Sanyaku in plain English
The classic "Sanyaku Koten / Gyakuten" (three signals agree) is labeled "3/3 Aligned Up / Down" and shown for four timeframes at once.
8. A multi-timeframe table that reads the same everywhere
Each timeframe row shows the latest closed bar of that timeframe, so the table gives the same answer on a 1H, 4H, D or W chart.
9. A cleaner chart by default
Only the Kijun ("the blade") and the Kumo are drawn by default. The blade is colored by the score and candles are colored by trend, so the reading is visible without the table. All other Ichimoku lines can be turned on.
HOW THE SCORE WORKS
Each check adds +1 (up), -1 (down) or 0 (neutral). Five checks give a score from -5 to +5, shown as -100% to +100% (each point = 20%).
1. Price vs the current Kumo: above = +1, below = -1, inside = 0
2. Tenkan vs Kijun: Tenkan above = +1, below = -1
3. Chikou: close above the high of the bar it is plotted against = +1, below that bar's low = -1, otherwise 0 (a stricter test than close-vs-close)
4. Future Kumo color: Senkou A above Senkou B = +1, below = -1
5. Kijun slope: Kijun higher than 5 bars ago = +1, lower = -1, flat = 0
Trend row in the dashboard:
• STRONG UP: +80% or more · UP: +60% · SIDEWAYS UP: +40%
• STRONG DOWN: -80% or less · DOWN: -60% · SIDEWAYS DOWN: -40%
• CHOP ZONE · NO ACTION: price inside the Kumo, or the score is between -20% and +20%. The chop zone overrides the score.
3/3 Aligned = checks 1, 2 and 3 all point the same way on the same bar. The label prints only on the first bar it becomes true.
Kumo thickness = the gap between Senkou A and B under the current bar, ranked against the last 252 bars: Thin (bottom 20%), Normal, Thick (top 20%). Technicians often treat a thick Kumo as a stronger support or resistance zone and a thin Kumo as easier to cross.
ON THE CHART
• Kijun "blade" line: green-to-red gradient by score, gray in the chop zone
• Kumo: shaded cloud, projected forward like the built-in Ichimoku (on by default)
• Tenkan, Chikou and the Senkou span lines: off by default, turn on under Lines
• ▲ Strong Up / ▼ Strong Down: score crossed the Strong threshold outside the chop zone
• 3/3 Aligned Up / Down labels: the three core signals agree
• Dashed orange line: Kijun magnet (Kijun flat for 8+ bars)
• Dashed purple line: Span B magnet (Senkou Span B flat for 8+ bars, drawn at its projected position)
• Candle colors: green / red / amber, or "Strength shades" (darker = stronger)
DASHBOARD
• Score: the chart's own timeframe, current bar
• Zone: Trending or Chop
• Kumo: Thin / Normal / Thick
• TF table (default 1H, 4H, D, W): score and 3/3 Aligned state for each timeframe
• Trend: the summary label described above
Important: every row in the TF table shows the latest CLOSED bar of that timeframe, so the table reads the same on any chart timeframe. The Score and Trend rows show the chart's current bar, which may still be forming. On a 1H chart, the Score row can therefore differ from the 1H row until the bar closes. Each timeframe has its own Kumo and lines, so a 1H reading and a D reading can point in different directions. That is normal. After switching timeframes the table needs a moment to load.
WHICH TIMEFRAME
Ichimoku was designed for the Daily chart. The Classic settings (9 / 26 / 52) match calendar spans on D: about 1.5 weeks, 1 month and 2 months of a 6-day trading week. For markets that trade 5 days a week there is a "5-Day Week" preset (7 / 22 / 44), and a "Crypto" preset (20 / 60 / 120) for 24/7 markets.
On intraday charts the same math works as plain bar counts, without the calendar meaning. Many technicians read D as the main chart and W as the bigger picture. The TF table shows both. No timeframe is claimed to be more accurate than another.
SETTINGS
Ichimoku
• Preset: Classic (default) / 5-Day Week / Crypto
• Kijun slope lookback: 5 bars
Signals
• Strong threshold: 4 (= 80%)
• Chop score band: 1 (= 20%)
• Show Strong Up / Down marks, Show 3/3 Aligned labels
Equilibrium Magnets
• Flat bars: 8 · Keep last: 6 lines (oldest deleted first)
Lines
• Tenkan, Chikou, Senkou spans (off), Kumo (on), Table (on) with size Tiny / Small / Normal / Large
• Color candles by trend (on): 3 colors or Strength shades
Colors: all line, cloud, candle and chop colors can be changed.
MTF table: four timeframes, default 60 / 240 / D / W.
ALERTS
Strong Up · Strong Down · Aligned Up · Aligned Down · Enter Chop · Exit Chop. All alerts fire on confirmed (closed) bars only.
WHO IT IS FOR
• Traders and students learning Ichimoku who want the five parts read in one place
• Chart readers who want a clear "chop / no reading" filter before studying a chart
Not for:
• Anyone looking for automatic entries, exits, targets or position sizing. The script draws none of these.
• Heikin Ashi, Renko or other non-standard chart types
COMMON MISTAKES
• Treating "Strong Up / Strong Down" as an instruction. It describes the Ichimoku state on a closed bar, nothing more.
• Ignoring the chop zone. Inside the Kumo the five checks often disagree and the score swings.
• Comparing the Score row with the same-timeframe row in the TF table on a forming bar (see Dashboard).
• Reading the projected Kumo as a forecast. It is plotted forward by design. It does not predict price.
DISCLOSURE
• Pine Script version: v6
• Open-source under the Mozilla Public License 2.0
• Repaint: NO for marks, labels, magnets and alerts, which are set only on confirmed bars. The Kijun color and candle colors on the live bar can change until that bar closes. The Kumo is plotted forward and the Chikou backward by the standard Ichimoku offsets. Plotted values do not change after a bar closes.
• Multi-timeframe: the TF table uses request.security and request.security_lower_tf to read the latest closed bar of each timeframe. It is shown on the last bar only and is not used for any mark, label or alert.
• Chart type: standard candles or bars only. Not for Heikin Ashi, Renko, Range, Kagi or Point & Figure.
• Original work: the score, chop zone, magnets and dashboard are the author's own logic built on the public Ichimoku Kinko Hyo method (Goichi Hosoda). No third-party code is reused.
Developed by Thiranat Ngamchitcharoen (Itto-Ryu).
DISCLAIMER
This indicator is published for educational and informational purposes only. It is not financial, investment or trading advice and does not recommend buying or selling any instrument. Signals and labels describe past and current chart conditions; they do not predict future prices. Past behavior of any indicator does not guarantee future results. Trading involves risk, including the loss of capital. You are solely responsible for your own decisions. Test any idea on your own data before relying on it.
Script de código abierto
Fiel al espíritu de TradingView, el creador de este script lo ha convertido en código abierto, para que los traders puedan revisar y verificar su funcionalidad. ¡Enhorabuena al autor! Aunque puede utilizarlo de forma gratuita, recuerde que cualquier republicación del código está sujeta a nuestras Normas internas.

Exención de responsabilidad
La información y las publicaciones no constituyen, ni deben considerarse como, asesoramiento o recomendaciones financieras, de inversión, de trading u otro tipo, proporcionadas o respaldadas por TradingView. Obtenga más información en Condiciones de uso.
Script de código abierto
Fiel al espíritu de TradingView, el creador de este script lo ha convertido en código abierto, para que los traders puedan revisar y verificar su funcionalidad. ¡Enhorabuena al autor! Aunque puede utilizarlo de forma gratuita, recuerde que cualquier republicación del código está sujeta a nuestras Normas internas.
Exención de responsabilidad
La información y las publicaciones no constituyen, ni deben considerarse como, asesoramiento o recomendaciones financieras, de inversión, de trading u otro tipo, proporcionadas o respaldadas por TradingView. Obtenga más información en Condiciones de uso.