OPEN-SOURCE SCRIPT
Actualizado Trend Confluence Filter
Trend Confluence Filter
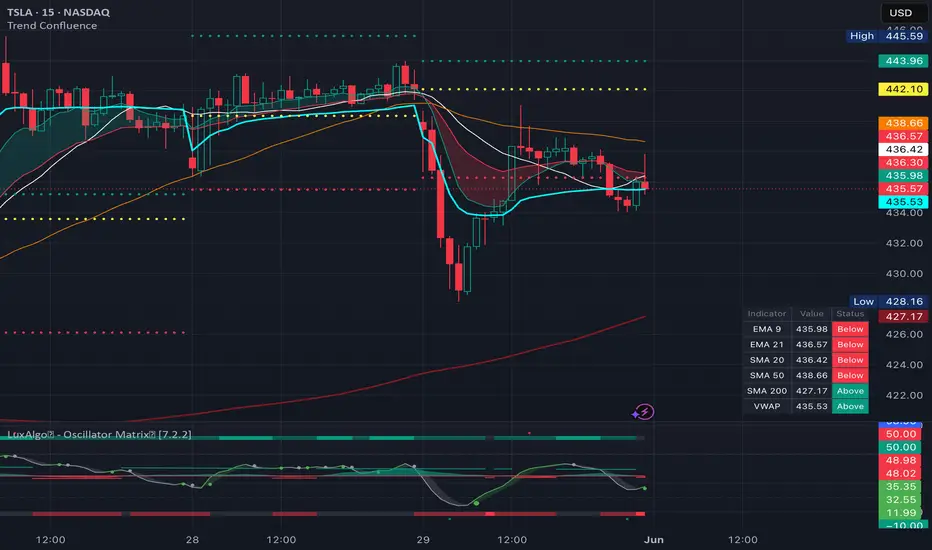
This is scripted to combine multiple separate indicators — moving average alignment, VWAP, and yesterday's levels — that are often used together into a single overlay, each with adjustable inputs.
What's on the chart:
Session VWAP — Primary signal and institutional reference
EMA 9 / 21 ribbon — 9 and 21 EMA lines with a green/red dynamic ribbon that flips from green or red when EMA is 9/21 or 21/9
SMA 20 / 50 / 200 — Long-term structure at a glance
Yesterday's high, low, and close — Benchmark reference
Dashboard table — Color-coded based on current price vs. each MA and VWAP
Signals:
Bullish: SMAs stacked up 20/50/200, 1-5M (Intraday) or 15M (Swing) candle closing above the VWAP with a green ribbon, very bullish on an expanding ribbon (9 EMA trending up more strongly than the 21)
Bearish: Mirror the above
Trade in the direction of the SMA stack. Take the pullback signal when it holds near VWAP or a prior-day level — that confluence is part of the whole idea.
No advanced logic or PT's/SL's built in to keep it simpler and more generalized.
Script by // © TylerisTrading
This is scripted to combine multiple separate indicators — moving average alignment, VWAP, and yesterday's levels — that are often used together into a single overlay, each with adjustable inputs.
What's on the chart:
Session VWAP — Primary signal and institutional reference
EMA 9 / 21 ribbon — 9 and 21 EMA lines with a green/red dynamic ribbon that flips from green or red when EMA is 9/21 or 21/9
SMA 20 / 50 / 200 — Long-term structure at a glance
Yesterday's high, low, and close — Benchmark reference
Dashboard table — Color-coded based on current price vs. each MA and VWAP
Signals:
Bullish: SMAs stacked up 20/50/200, 1-5M (Intraday) or 15M (Swing) candle closing above the VWAP with a green ribbon, very bullish on an expanding ribbon (9 EMA trending up more strongly than the 21)
Bearish: Mirror the above
Trade in the direction of the SMA stack. Take the pullback signal when it holds near VWAP or a prior-day level — that confluence is part of the whole idea.
No advanced logic or PT's/SL's built in to keep it simpler and more generalized.
Script by // © TylerisTrading
Notas de prensa
Trend Confluence Filter combines multiple trend-following and market structure tools into a single clean overlay, helping traders quickly identify high-probability pullback opportunities at a quick glance by color-coding each level.The indicator plots a complete trend framework using the 20, 50, and 200 SMAs, 9 and 21 EMAs, session VWAP, and key previous-day levels (High, Low, and Close). A bullish trend is defined by a stacked SMA structure (20 > 50 > 200), while a bearish trend requires the inverse alignment.
An EMA ribbon between the 9 and 21 EMAs visually highlights short-term momentum, changing color based on trend direction. The indicator also monitors price interaction with the VWAP/SMA20 confluence area and generates pullback signals when price retraces into this zone and resumes in the direction of the prevailing trend.
Features include:
• 20, 50, and 200 SMA trend stack visualization
• 9/21 EMA crossover ribbon with dynamic bullish/bearish shading
• Session VWAP for intraday bias and mean value reference
• Previous Day High, Low, and Close levels
• Bullish and bearish pullback entry signals based on trend confluence
• Customizable colors and display settings
• Real-time dashboard showing price position relative to all key averages and VWAP
• Built-in alert function for EMA crossovers and price/VWAP crossovers
This indicator is designed for trend traders seeking objective confluence between moving averages, VWAP, and market structure to improve trade selection and directional bias.
Script de código abierto
Fiel al espíritu de TradingView, el creador de este script lo ha convertido en código abierto, para que los traders puedan revisar y verificar su funcionalidad. ¡Enhorabuena al autor! Aunque puede utilizarlo de forma gratuita, recuerde que cualquier republicación del código está sujeta a nuestras Normas internas.

// © TylerisTrading
Exención de responsabilidad
La información y las publicaciones no constituyen, ni deben considerarse como, asesoramiento o recomendaciones financieras, de inversión, de trading u otro tipo, proporcionadas o respaldadas por TradingView. Obtenga más información en Condiciones de uso.
Script de código abierto
Fiel al espíritu de TradingView, el creador de este script lo ha convertido en código abierto, para que los traders puedan revisar y verificar su funcionalidad. ¡Enhorabuena al autor! Aunque puede utilizarlo de forma gratuita, recuerde que cualquier republicación del código está sujeta a nuestras Normas internas.
// © TylerisTrading
Exención de responsabilidad
La información y las publicaciones no constituyen, ni deben considerarse como, asesoramiento o recomendaciones financieras, de inversión, de trading u otro tipo, proporcionadas o respaldadas por TradingView. Obtenga más información en Condiciones de uso.