OPEN-SOURCE SCRIPT
BK AK-Iron Rain
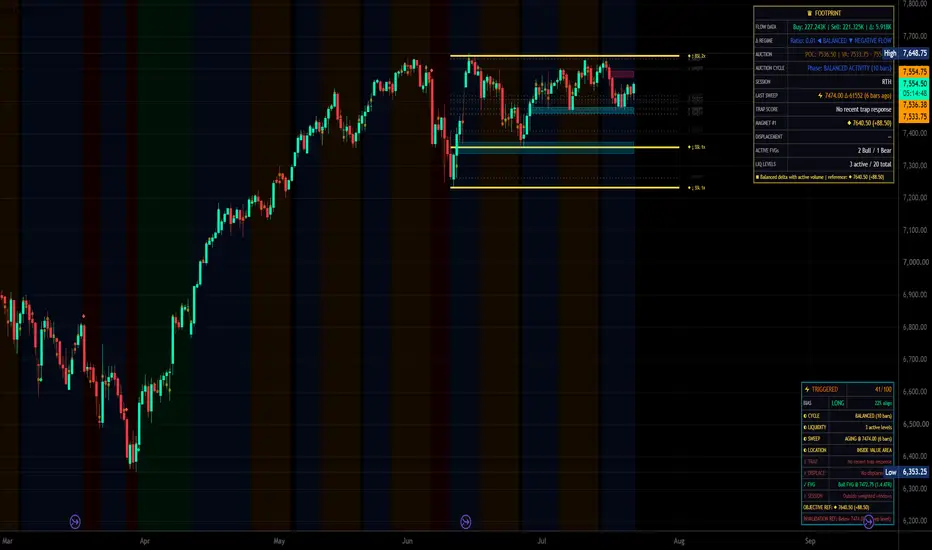
BK AK-Iron Rain
Map the structure. Measure the auction. Track the sweep and response.
The “AK” in BK AK-Iron Rain is not branding—it is honor. It stands for my mentor, A.K.—the man whose guidance shaped my discipline, patience, market judgment, and respect for clean execution. I dedicate every indicator I build to his honor.
Above all, full credit and gratitude to G-d—the source of wisdom, timing, strength, and survival in this game.
BK AK-Iron Rain is a footprint-enhanced liquidity, auction, sweep, reversal, displacement, and execution-context framework.
It is designed to answer:
Where are the principal structural levels?
Which unswept levels carry the strongest current score?
Has price swept and reclaimed one of those levels?
Does footprint delta support or oppose the price response?
Is the market balanced, sweeping, or expanding directionally?
Has displacement created an active Fair Value Gap?
Do the available conditions support a directional setup?
The modules operate through one connected sequence:
Structural pivots → liquidity clustering → level scoring → sweep detection → footprint response → trap or reversal analysis → displacement → FVG tracking → execution context.
Footprint Core
Iron Rain uses TradingView footprint data to retrieve:
Buy volume
Sell volume
Volume delta
Total analyzed volume
Point of Control
Value Area High
Value Area Low
The Ticks Per Row input controls footprint-row aggregation. Smaller values provide finer segmentation, while larger values create broader rows.
The Value Area % input determines the percentage of footprint volume included within the calculated value area.
Footprint data is used to enhance level scoring, sweep analysis, reversal factors, displacement quality, POC context, and dashboard interpretation.
The footprint calculations do not display the full order book, resting liquidity, or the identity of individual market participants.
Liquidity Pool Mapper
The Liquidity Pool Mapper begins with confirmed chart and optional higher-timeframe pivots.
Nearby pivots are clustered into common price levels using an ATR-based distance threshold. Each tracked level records:
Price
Number of touches
First and most recent detection
Age
Higher-timeframe status
Proximity to prior daily or weekly levels
Proximity to round-number references
Footprint disagreement observed during tests
Swept or unswept status
Each level receives a relative score based on:
Touch count
Recency
Key-level confluence
Higher-timeframe origin
Footprint response
Time decay
The score ranks the script’s tracked levels against one another. It is not a probability that price will reach or reverse from the level.
Magnet Lines
The highest-ranked unswept levels can be displayed as Magnet Lines.
The script identifies directional reference levels above and below current price and uses them as potential structural objectives within the dashboard and execution panel.
A Magnet Line means the level ranks highly under the configured scoring model. It does not mean price is guaranteed to trade there.
Swept levels can be hidden or retained in a dimmed state.
Sweeps and Failed Breaks
A sweep is recorded when price moves through a tracked level and closes back across it according to the script’s reclaim conditions.
Iron Rain stores:
Swept price
Sweep direction
Footprint delta on the sweep
Age of the sweep
Associated level quality
A sweep does not independently establish reversal. It becomes more meaningful when followed by counter-delta, price reclamation, rejection, displacement, or additional structural confluence.
Auction Cycle Model
The cycle engine classifies the current condition into four model states:
Balanced Activity
Sweep Phase
Bullish Expansion
Bearish Expansion
Balanced Activity requires relatively low absolute delta compared with total volume while overall footprint volume remains active.
The Sweep Phase begins when a tracked structural level is swept after a qualifying balanced period.
Bullish or bearish expansion requires directional footprint delta and a candle body exceeding the configured ATR threshold.
These are rule-based auction classifications. They do not prove accumulation, manipulation, distribution, or market-maker activity.
Trap Analysis
The trap module evaluates a swept level during the configured reclaim window.
Its score can include:
Change between sweep delta and reclaim delta
Magnitude of reclaim delta
Speed of reclamation
Quality of the swept level
Session context
Higher-timeframe status
Key-level confluence
Value Area location
Prior footprint disagreement at the level
Optional filters can restrict visible trap markers to recent-range extremes with a minimum number of supporting factors.
A high trap score means more of the enabled conditions agree. It is not a success probability.
Reversal Signals
The reversal engine separately evaluates current-bar conditions near the upper or lower portion of the recent range.
Its four factors are:
Delta pressure weakening relative to the prior bar
Price testing a tracked structural level
POC forming near one side of the candle while price closes away from it
Total footprint volume substantially exceeding its average
A reversal arrow appears when the required number of factors align at a qualifying range extreme.
The arrow identifies a possible reversal condition. It does not guarantee that the current candle is the final high or low.
Displacement Scanner
A displacement condition requires:
Footprint delta materially above its smoothed average
A candle body exceeding the configured ATR multiple
Directional agreement between delta and the candle
The marker tooltip displays:
Direction
Delta
Body size in ATR units
Current POC
Displacement describes unusually strong directional participation and price movement. It does not guarantee continuation.
Fair Value Gaps
Iron Rain identifies three-candle bullish and bearish price gaps.
Each active FVG stores:
Upper boundary
Lower boundary
Midpoint
Direction
Age
Fill percentage
Footprint-based quality score
Delta strength
The visual treatment can distinguish stronger and weaker FVG scores.
An FVG is removed when it becomes fully filled or exceeds its configured maximum age.
The FVG quality score combines candle geometry, delta dominance, delta magnitude, POC location, and session weighting. It is a relative model score—not a probability that the gap will hold.
Value Area and POC
Iron Rain can display:
Bar-level POC markers
VAH
VAL
Shaded Value Area
Price above VAH is treated as trading above the current calculated value region.
Price below VAL is treated as trading below it.
Price inside the Value Area indicates trade within the footprint’s calculated high-volume region.
These relationships provide auction location, not automatic reversal or continuation instructions.
Sessions
The script supports configurable:
Asia session
London analysis window
New York analysis window
New York lunch period
Session context can contribute to setup and quality scores.
The London and New York windows receive configurable weighting, while lunch can receive reduced weighting.
This weighting reflects the model’s settings and does not guarantee that one session will outperform another.
Narrative Dashboard
The dashboard summarizes:
Footprint buy and sell volume
Delta and delta regime
POC, VAH, and VAL
Current auction-cycle state
Session
Most recent sweep
Recent trap score
Highest-ranked Magnet Line
Current displacement
Active bullish and bearish FVGs
Number of tracked liquidity levels
Its final row provides a compact interpretation of the current model state.
The dashboard is a summary surface. The underlying conditions should be reviewed before using its narrative.
Execution Panel
The Execution Panel combines eight checkpoints:
Auction-cycle state
Number of active liquidity levels
Freshness of the most recent sweep
Price location relative to Value Area
Recent trap score
Current or recent displacement
Distance to the nearest active FVG
Current session window
The resulting setup score ranges from 0 to 100.
The panel can display:
Scanning
Stalking
Triggered
Ready Long
Ready Short
Conflict
Managing
Directional bias is calculated from a weighted vote using sweep direction, trap direction, displacement, smoothed delta, and Value Area location.
The displayed confidence is the normalized strength of that internal vote. It is not a statistical win probability.
Targets reference the nearest qualifying Magnet Line in the direction of the bias.
Stop references use a recent sweep level or Value Area boundary when available.
Those levels are analytical references and not personalized trade instructions.
How to Use BK AK-Iron Rain
Use a standard OHLC chart on a market with footprint data available.
Set Ticks Per Row according to the instrument and timeframe. Smaller settings provide finer detail but can create noisier readings.
Review the liquidity map first. Identify active levels, Magnet Lines, higher-timeframe levels, and prior daily or weekly confluence.
Wait for interaction with a level. A tracked line alone is not a setup. Watch for a sweep, rejection, repeated test, or displacement.
Check the footprint response. Compare price movement with delta, POC location, total volume, and the Value Area.
Read the cycle state as context. Balanced activity represents compression, the Sweep Phase represents a level event, and Expansion represents directional movement after the model’s conditions align.
Evaluate trap and reversal evidence separately. Trap logic requires a prior sweep and reclaim. Reversal arrows evaluate current-bar exhaustion, rejection, POC, and volume factors.
Use FVGs as structural entry or reaction zones. Review direction, distance, fill percentage, and quality rather than treating every gap equally.
Read the execution panel last. The setup score summarizes the modules; it should not replace inspection of the underlying conditions.
Treat READY as qualified context—not an order. Confirm the directional bias with current price behavior and define risk independently.
Realtime Behavior and Limitations
Footprint values can change while the active candle forms.
TradingView footprint data can differ between real-time and later historical recalculation because the available intrabar source may change.
Chart pivots require right-side confirmation bars.
Higher-timeframe pivots can update while their source structure develops.
Liquidity labels represent modeled pivot clusters, not visible resting orders.
Sweep, trap, reversal, displacement, and cycle classifications can fail.
POC and Value Area depend on the selected footprint aggregation.
FVGs are price gaps and may fill immediately or provide no reaction.
The execution panel does not submit orders, model slippage, or manage positions.
Original Framework
Pivots, footprint delta, POC, Value Area, liquidity sweeps, AMD terminology, FVGs, ATR, and session analysis are established concepts.
The distinctive BK architecture is the dependency connecting:
ATR-clustered chart and higher-timeframe pivots
Time-decayed liquidity scoring
Footprint-response scoring at structural levels
Ranked directional Magnet Lines
Persistent sweep memory
Auction-cycle classification
Reclaim-based trap scoring
Current-bar reversal-factor analysis
Footprint-qualified displacement
Quality-ranked FVG tracking
A narrative dashboard
An eight-checkpoint execution panel
Structure identifies the level. Footprint measures participation. The sweep creates the event. Reclamation or displacement reveals the response. The execution panel summarizes the evidence.
Risk Disclosure
BK AK-Iron Rain is provided for analytical and educational purposes.
It does not provide investment advice, guarantee performance, identify institutional intent with certainty, or eliminate trading risk.
Users remain responsible for their own analysis, entries, exits, position sizing, stops, execution, and account risk.
Map the level. Measure the response. Respect the invalidation.
Map the structure. Measure the auction. Track the sweep and response.
The “AK” in BK AK-Iron Rain is not branding—it is honor. It stands for my mentor, A.K.—the man whose guidance shaped my discipline, patience, market judgment, and respect for clean execution. I dedicate every indicator I build to his honor.
Above all, full credit and gratitude to G-d—the source of wisdom, timing, strength, and survival in this game.
BK AK-Iron Rain is a footprint-enhanced liquidity, auction, sweep, reversal, displacement, and execution-context framework.
It is designed to answer:
Where are the principal structural levels?
Which unswept levels carry the strongest current score?
Has price swept and reclaimed one of those levels?
Does footprint delta support or oppose the price response?
Is the market balanced, sweeping, or expanding directionally?
Has displacement created an active Fair Value Gap?
Do the available conditions support a directional setup?
The modules operate through one connected sequence:
Structural pivots → liquidity clustering → level scoring → sweep detection → footprint response → trap or reversal analysis → displacement → FVG tracking → execution context.
Footprint Core
Iron Rain uses TradingView footprint data to retrieve:
Buy volume
Sell volume
Volume delta
Total analyzed volume
Point of Control
Value Area High
Value Area Low
The Ticks Per Row input controls footprint-row aggregation. Smaller values provide finer segmentation, while larger values create broader rows.
The Value Area % input determines the percentage of footprint volume included within the calculated value area.
Footprint data is used to enhance level scoring, sweep analysis, reversal factors, displacement quality, POC context, and dashboard interpretation.
The footprint calculations do not display the full order book, resting liquidity, or the identity of individual market participants.
Liquidity Pool Mapper
The Liquidity Pool Mapper begins with confirmed chart and optional higher-timeframe pivots.
Nearby pivots are clustered into common price levels using an ATR-based distance threshold. Each tracked level records:
Price
Number of touches
First and most recent detection
Age
Higher-timeframe status
Proximity to prior daily or weekly levels
Proximity to round-number references
Footprint disagreement observed during tests
Swept or unswept status
Each level receives a relative score based on:
Touch count
Recency
Key-level confluence
Higher-timeframe origin
Footprint response
Time decay
The score ranks the script’s tracked levels against one another. It is not a probability that price will reach or reverse from the level.
Magnet Lines
The highest-ranked unswept levels can be displayed as Magnet Lines.
The script identifies directional reference levels above and below current price and uses them as potential structural objectives within the dashboard and execution panel.
A Magnet Line means the level ranks highly under the configured scoring model. It does not mean price is guaranteed to trade there.
Swept levels can be hidden or retained in a dimmed state.
Sweeps and Failed Breaks
A sweep is recorded when price moves through a tracked level and closes back across it according to the script’s reclaim conditions.
Iron Rain stores:
Swept price
Sweep direction
Footprint delta on the sweep
Age of the sweep
Associated level quality
A sweep does not independently establish reversal. It becomes more meaningful when followed by counter-delta, price reclamation, rejection, displacement, or additional structural confluence.
Auction Cycle Model
The cycle engine classifies the current condition into four model states:
Balanced Activity
Sweep Phase
Bullish Expansion
Bearish Expansion
Balanced Activity requires relatively low absolute delta compared with total volume while overall footprint volume remains active.
The Sweep Phase begins when a tracked structural level is swept after a qualifying balanced period.
Bullish or bearish expansion requires directional footprint delta and a candle body exceeding the configured ATR threshold.
These are rule-based auction classifications. They do not prove accumulation, manipulation, distribution, or market-maker activity.
Trap Analysis
The trap module evaluates a swept level during the configured reclaim window.
Its score can include:
Change between sweep delta and reclaim delta
Magnitude of reclaim delta
Speed of reclamation
Quality of the swept level
Session context
Higher-timeframe status
Key-level confluence
Value Area location
Prior footprint disagreement at the level
Optional filters can restrict visible trap markers to recent-range extremes with a minimum number of supporting factors.
A high trap score means more of the enabled conditions agree. It is not a success probability.
Reversal Signals
The reversal engine separately evaluates current-bar conditions near the upper or lower portion of the recent range.
Its four factors are:
Delta pressure weakening relative to the prior bar
Price testing a tracked structural level
POC forming near one side of the candle while price closes away from it
Total footprint volume substantially exceeding its average
A reversal arrow appears when the required number of factors align at a qualifying range extreme.
The arrow identifies a possible reversal condition. It does not guarantee that the current candle is the final high or low.
Displacement Scanner
A displacement condition requires:
Footprint delta materially above its smoothed average
A candle body exceeding the configured ATR multiple
Directional agreement between delta and the candle
The marker tooltip displays:
Direction
Delta
Body size in ATR units
Current POC
Displacement describes unusually strong directional participation and price movement. It does not guarantee continuation.
Fair Value Gaps
Iron Rain identifies three-candle bullish and bearish price gaps.
Each active FVG stores:
Upper boundary
Lower boundary
Midpoint
Direction
Age
Fill percentage
Footprint-based quality score
Delta strength
The visual treatment can distinguish stronger and weaker FVG scores.
An FVG is removed when it becomes fully filled or exceeds its configured maximum age.
The FVG quality score combines candle geometry, delta dominance, delta magnitude, POC location, and session weighting. It is a relative model score—not a probability that the gap will hold.
Value Area and POC
Iron Rain can display:
Bar-level POC markers
VAH
VAL
Shaded Value Area
Price above VAH is treated as trading above the current calculated value region.
Price below VAL is treated as trading below it.
Price inside the Value Area indicates trade within the footprint’s calculated high-volume region.
These relationships provide auction location, not automatic reversal or continuation instructions.
Sessions
The script supports configurable:
Asia session
London analysis window
New York analysis window
New York lunch period
Session context can contribute to setup and quality scores.
The London and New York windows receive configurable weighting, while lunch can receive reduced weighting.
This weighting reflects the model’s settings and does not guarantee that one session will outperform another.
Narrative Dashboard
The dashboard summarizes:
Footprint buy and sell volume
Delta and delta regime
POC, VAH, and VAL
Current auction-cycle state
Session
Most recent sweep
Recent trap score
Highest-ranked Magnet Line
Current displacement
Active bullish and bearish FVGs
Number of tracked liquidity levels
Its final row provides a compact interpretation of the current model state.
The dashboard is a summary surface. The underlying conditions should be reviewed before using its narrative.
Execution Panel
The Execution Panel combines eight checkpoints:
Auction-cycle state
Number of active liquidity levels
Freshness of the most recent sweep
Price location relative to Value Area
Recent trap score
Current or recent displacement
Distance to the nearest active FVG
Current session window
The resulting setup score ranges from 0 to 100.
The panel can display:
Scanning
Stalking
Triggered
Ready Long
Ready Short
Conflict
Managing
Directional bias is calculated from a weighted vote using sweep direction, trap direction, displacement, smoothed delta, and Value Area location.
The displayed confidence is the normalized strength of that internal vote. It is not a statistical win probability.
Targets reference the nearest qualifying Magnet Line in the direction of the bias.
Stop references use a recent sweep level or Value Area boundary when available.
Those levels are analytical references and not personalized trade instructions.
How to Use BK AK-Iron Rain
Use a standard OHLC chart on a market with footprint data available.
Set Ticks Per Row according to the instrument and timeframe. Smaller settings provide finer detail but can create noisier readings.
Review the liquidity map first. Identify active levels, Magnet Lines, higher-timeframe levels, and prior daily or weekly confluence.
Wait for interaction with a level. A tracked line alone is not a setup. Watch for a sweep, rejection, repeated test, or displacement.
Check the footprint response. Compare price movement with delta, POC location, total volume, and the Value Area.
Read the cycle state as context. Balanced activity represents compression, the Sweep Phase represents a level event, and Expansion represents directional movement after the model’s conditions align.
Evaluate trap and reversal evidence separately. Trap logic requires a prior sweep and reclaim. Reversal arrows evaluate current-bar exhaustion, rejection, POC, and volume factors.
Use FVGs as structural entry or reaction zones. Review direction, distance, fill percentage, and quality rather than treating every gap equally.
Read the execution panel last. The setup score summarizes the modules; it should not replace inspection of the underlying conditions.
Treat READY as qualified context—not an order. Confirm the directional bias with current price behavior and define risk independently.
Realtime Behavior and Limitations
Footprint values can change while the active candle forms.
TradingView footprint data can differ between real-time and later historical recalculation because the available intrabar source may change.
Chart pivots require right-side confirmation bars.
Higher-timeframe pivots can update while their source structure develops.
Liquidity labels represent modeled pivot clusters, not visible resting orders.
Sweep, trap, reversal, displacement, and cycle classifications can fail.
POC and Value Area depend on the selected footprint aggregation.
FVGs are price gaps and may fill immediately or provide no reaction.
The execution panel does not submit orders, model slippage, or manage positions.
Original Framework
Pivots, footprint delta, POC, Value Area, liquidity sweeps, AMD terminology, FVGs, ATR, and session analysis are established concepts.
The distinctive BK architecture is the dependency connecting:
ATR-clustered chart and higher-timeframe pivots
Time-decayed liquidity scoring
Footprint-response scoring at structural levels
Ranked directional Magnet Lines
Persistent sweep memory
Auction-cycle classification
Reclaim-based trap scoring
Current-bar reversal-factor analysis
Footprint-qualified displacement
Quality-ranked FVG tracking
A narrative dashboard
An eight-checkpoint execution panel
Structure identifies the level. Footprint measures participation. The sweep creates the event. Reclamation or displacement reveals the response. The execution panel summarizes the evidence.
Risk Disclosure
BK AK-Iron Rain is provided for analytical and educational purposes.
It does not provide investment advice, guarantee performance, identify institutional intent with certainty, or eliminate trading risk.
Users remain responsible for their own analysis, entries, exits, position sizing, stops, execution, and account risk.
Map the level. Measure the response. Respect the invalidation.
Script de código abierto
Fiel al espíritu de TradingView, el creador de este script lo ha convertido en código abierto, para que los traders puedan revisar y verificar su funcionalidad. ¡Enhorabuena al autor! Aunque puede utilizarlo de forma gratuita, recuerde que cualquier republicación del código está sujeta a nuestras Normas internas.

Exención de responsabilidad
La información y las publicaciones no constituyen, ni deben considerarse como, asesoramiento o recomendaciones financieras, de inversión, de trading u otro tipo, proporcionadas o respaldadas por TradingView. Obtenga más información en Condiciones de uso.
Script de código abierto
Fiel al espíritu de TradingView, el creador de este script lo ha convertido en código abierto, para que los traders puedan revisar y verificar su funcionalidad. ¡Enhorabuena al autor! Aunque puede utilizarlo de forma gratuita, recuerde que cualquier republicación del código está sujeta a nuestras Normas internas.
Exención de responsabilidad
La información y las publicaciones no constituyen, ni deben considerarse como, asesoramiento o recomendaciones financieras, de inversión, de trading u otro tipo, proporcionadas o respaldadas por TradingView. Obtenga más información en Condiciones de uso.