EMA 50/100 + Candle Trend | Albert Setups
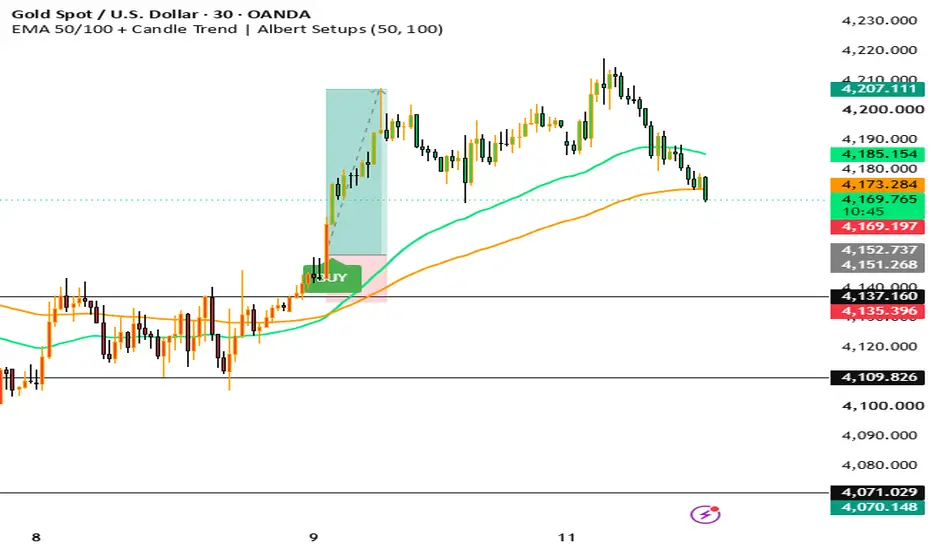
# EMA 50/100 + Candle Trend | Albert Setups 📊
**Trade with the Trend. Identify Momentum. Spot Buy & Sell Signals.**
The EMA 50/100 + Candle Trend indicator is designed to help traders identify market direction and potential trading opportunities through two exponential moving averages (EMAs).
### 🔹 Key Features
* **EMA 50 (Green Line):** Tracks shorter-term price momentum.
* **EMA 100 (Orange Line):** Helps identify the broader trend direction.
* **BUY Signal 🟢:** Appears when EMA 50 crosses above EMA 100 on a confirmed candle close.
* **SELL Signal 🔴:** Appears when EMA 50 crosses below EMA 100 on a confirmed candle close.
* **Trend-Based Candlestick Colors:** Green candles indicate a bullish EMA trend bias, while red candles indicate a bearish EMA trend bias.
* **Clean Chart Design:** Simple visuals make trend direction and crossover signals easier to understand.
### 🔹 How to Use
**Bullish Setup:** When EMA 50 crosses above EMA 100, the indicator generates a BUY signal, suggesting potential bullish momentum.
**Bearish Setup:** When EMA 50 crosses below EMA 100, the indicator generates a SELL signal, suggesting potential bearish momentum.
**Trend Confirmation:** Traders can use price action, support and resistance, and higher-timeframe analysis to confirm signals before entering a trade.
### 🔹 Suitable Markets
* Forex
* Gold (XAUUSD)
* Cryptocurrency
* Indices
**Trade with the Trend. Identify Momentum. Spot Buy & Sell Signals.**
The EMA 50/100 + Candle Trend indicator is designed to help traders identify market direction and potential trading opportunities through two exponential moving averages (EMAs).
### 🔹 Key Features
* **EMA 50 (Green Line):** Tracks shorter-term price momentum.
* **EMA 100 (Orange Line):** Helps identify the broader trend direction.
* **BUY Signal 🟢:** Appears when EMA 50 crosses above EMA 100 on a confirmed candle close.
* **SELL Signal 🔴:** Appears when EMA 50 crosses below EMA 100 on a confirmed candle close.
* **Trend-Based Candlestick Colors:** Green candles indicate a bullish EMA trend bias, while red candles indicate a bearish EMA trend bias.
* **Clean Chart Design:** Simple visuals make trend direction and crossover signals easier to understand.
### 🔹 How to Use
**Bullish Setup:** When EMA 50 crosses above EMA 100, the indicator generates a BUY signal, suggesting potential bullish momentum.
**Bearish Setup:** When EMA 50 crosses below EMA 100, the indicator generates a SELL signal, suggesting potential bearish momentum.
**Trend Confirmation:** Traders can use price action, support and resistance, and higher-timeframe analysis to confirm signals before entering a trade.
### 🔹 Suitable Markets
* Forex
* Gold (XAUUSD)
* Cryptocurrency
* Indices

Exención de responsabilidad
La información y las publicaciones no constituyen, ni deben considerarse como, asesoramiento o recomendaciones financieras, de inversión, de trading u otro tipo, proporcionadas o respaldadas por TradingView. Obtenga más información en Condiciones de uso.
Exención de responsabilidad
La información y las publicaciones no constituyen, ni deben considerarse como, asesoramiento o recomendaciones financieras, de inversión, de trading u otro tipo, proporcionadas o respaldadas por TradingView. Obtenga más información en Condiciones de uso.