OPEN-SOURCE SCRIPT
J - percentile channel
(2022)
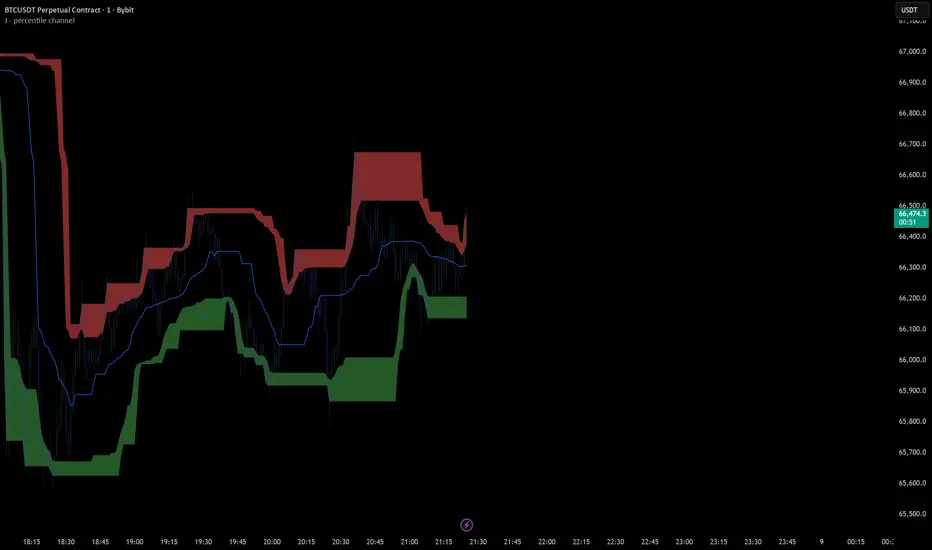
This indicator visualizes price distribution zones using percentile ranges over a configurable lookback period (default: 30 bars).
when price is in the red zone, it's historically high relative to recent bars; when in the green zone, it's historically low. Traders use this to spot potential reversals or confirm trend extremes.
This indicator visualizes price distribution zones using percentile ranges over a configurable lookback period (default: 30 bars).
- Upper zone (90th–100th percentile) — shaded red, marks overbought/resistance area
- Lower zone (0th–10th percentile) — shaded green, marks oversold/support area
- Midline (50th percentile) — acts as a dynamic median/equilibrium line
when price is in the red zone, it's historically high relative to recent bars; when in the green zone, it's historically low. Traders use this to spot potential reversals or confirm trend extremes.
Script de código abierto
Fiel al espíritu de TradingView, el creador de este script lo ha convertido en código abierto, para que los traders puedan revisar y verificar su funcionalidad. ¡Enhorabuena al autor! Aunque puede utilizarlo de forma gratuita, recuerde que cualquier republicación del código está sujeta a nuestras Normas internas.

Join the Growing (Econophysics Trading) Community! ⚛️
discord.com/invite/qb4RKFdwYJ
Trade the physics of price.
discord.com/invite/qb4RKFdwYJ
Trade the physics of price.
Exención de responsabilidad
La información y las publicaciones no constituyen, ni deben considerarse como, asesoramiento o recomendaciones financieras, de inversión, de trading u otro tipo, proporcionadas o respaldadas por TradingView. Obtenga más información en Condiciones de uso.
Script de código abierto
Fiel al espíritu de TradingView, el creador de este script lo ha convertido en código abierto, para que los traders puedan revisar y verificar su funcionalidad. ¡Enhorabuena al autor! Aunque puede utilizarlo de forma gratuita, recuerde que cualquier republicación del código está sujeta a nuestras Normas internas.
Join the Growing (Econophysics Trading) Community! ⚛️
discord.com/invite/qb4RKFdwYJ
Trade the physics of price.
discord.com/invite/qb4RKFdwYJ
Trade the physics of price.
Exención de responsabilidad
La información y las publicaciones no constituyen, ni deben considerarse como, asesoramiento o recomendaciones financieras, de inversión, de trading u otro tipo, proporcionadas o respaldadas por TradingView. Obtenga más información en Condiciones de uso.