OPEN-SOURCE SCRIPT
Actualizado RSI Mr. Love
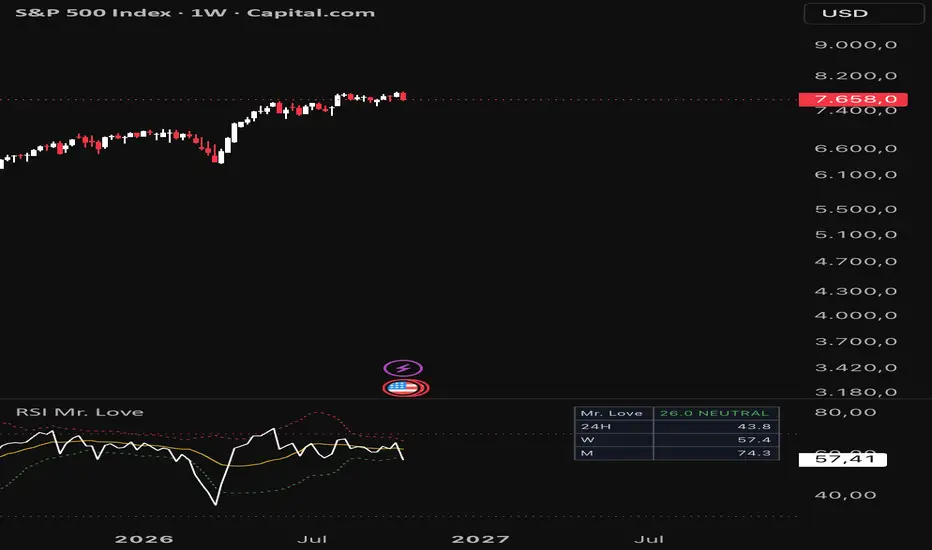
RSI Mr. Love is a cleaner, more informative version of the classic RSI. It keeps the standard RSI calculation and adds the context you usually have to piece together from several indicators: a smoothed trend line, adaptive bands, a percentile-based score, and the RSI of higher timeframes, all in one pane.
WHAT MAKES IT DIFFERENT
1. Mr. Love Score (percentile rank)
Instead of judging the RSI only against fixed levels like 70/30, the score shows where the current RSI sits compared to its own recent history (default: last 100 bars), on a scale from 0 to 100. A score of 85 means the RSI is higher than in 85% of the lookback period. This adapts to each market: a volatile coin and a calm blue-chip stock get their own "normal" range.
- Score >= 80: OVERBOUGHT (red)
- Score <= 20: OVERSOLD (blue)
- In between: NEUTRAL (green)
2. Multi-timeframe RSI table
The table shows the RSI of the daily (24H), weekly (W) and monthly (M) timeframes next to the score, so you can see at a glance whether short-term momentum agrees with the bigger picture. All three timeframes can be changed in the settings.
3. Adaptive dotted bands
Red (upper) and green (lower) bands are drawn around the RSI moving average, based on the RSI's own standard deviation. They widen in volatile phases and tighten in quiet ones, which highlights moves that are unusual for the current market environment.
4. Clean, minimal design
White RSI line, yellow moving average, dotted 70/30 zones, no background fills. Only the RSI value is shown on the price scale, so the pane stays readable even when it is small.
HOW TO USE
- Trend: RSI above its yellow average = momentum is improving; below = momentum is fading.
- Extremes: A touch of the red or green band signals an unusually strong move relative to recent volatility. Watch for the RSI turning back inside the band.
- Confirmation: Signals are stronger when the score and the 24H / W / M values point in the same direction. Example: an OVERSOLD score while the weekly RSI is still above 50 can indicate a pullback within an intact uptrend.
- Higher timeframes: On intraday charts (e.g. 1h, 4h, 8h) the 24H row gives you the daily RSI without switching charts.
SETTINGS
- RSI: length (default 14) and source
- Yellow line: type (SMA, EMA, SMMA, WMA) and length
- Bands: length and distance multiplier
- Zones: upper and lower levels (default 70 / 30)
- Table: score lookback, overbought/oversold thresholds, timeframes for each row
NOTES
The RSI calculation is identical to TradingView's built-in RSI. The multi-timeframe values update in real time and are final once the higher-timeframe candle closes. This indicator is a tool for analysis, not a buy or sell recommendation. Always combine it with your own risk management.
Notas de prensa
Just changed the Thumbnail.Script de código abierto
Fiel al espíritu de TradingView, el creador de este script lo ha convertido en código abierto, para que los traders puedan revisar y verificar su funcionalidad. ¡Enhorabuena al autor! Aunque puede utilizarlo de forma gratuita, recuerde que cualquier republicación del código está sujeta a nuestras Normas internas.

Exención de responsabilidad
La información y las publicaciones no constituyen, ni deben considerarse como, asesoramiento o recomendaciones financieras, de inversión, de trading u otro tipo, proporcionadas o respaldadas por TradingView. Obtenga más información en Condiciones de uso.
Script de código abierto
Fiel al espíritu de TradingView, el creador de este script lo ha convertido en código abierto, para que los traders puedan revisar y verificar su funcionalidad. ¡Enhorabuena al autor! Aunque puede utilizarlo de forma gratuita, recuerde que cualquier republicación del código está sujeta a nuestras Normas internas.
Exención de responsabilidad
La información y las publicaciones no constituyen, ni deben considerarse como, asesoramiento o recomendaciones financieras, de inversión, de trading u otro tipo, proporcionadas o respaldadas por TradingView. Obtenga más información en Condiciones de uso.