OPEN-SOURCE SCRIPT
Actualizado Price Action Structure
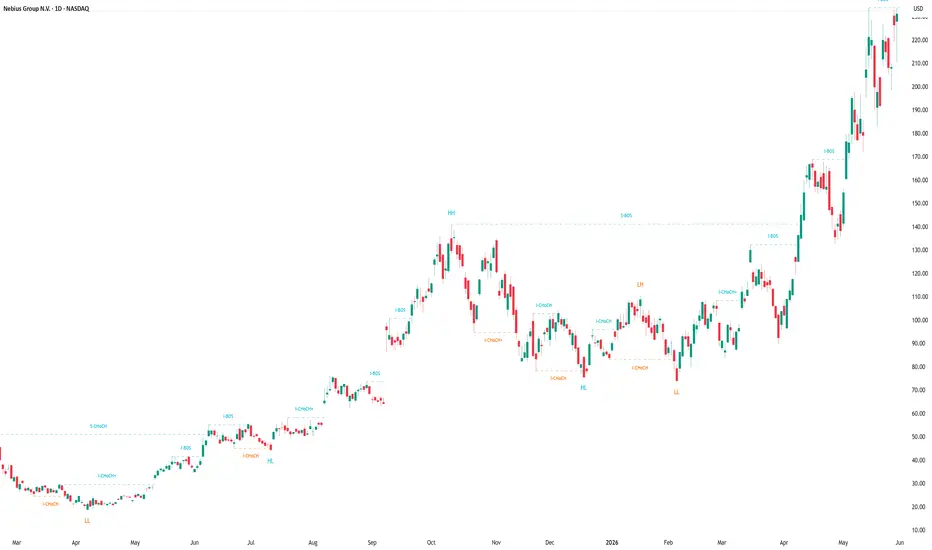
Price Action Structure is an open price-action toolkit designed to help traders read market structure, structural breaks, order block context, premium/discount zones, previous daily and weekly levels, qualified setup conditions, and optional Fair Value Gaps.
This is an indicator, not a strategy. It does not place trades, does not execute orders, and does not produce Strategy Tester results. The tool is designed for chart analysis, market-structure study, and visual context only.
Main modules
1. Market Structure
The indicator identifies both Internal Structure and Swing Structure.
Internal Structure
Internal Structure uses a shorter pivot length and is designed to show faster short-term structure changes. It can mark:
* Internal BOS
* Internal CHoCH
* Internal CHoCH+
Swing Structure
Swing Structure uses a longer pivot length and is designed to show higher-level market structure. It can mark:
* Swing BOS
* Swing CHoCH
* Swing CHoCH+
Label meaning
BOS means Break of Structure.
A bullish BOS appears when price closes above a confirmed structural high.
A bearish BOS appears when price closes below a confirmed structural low.
CHoCH means Change of Character.
A bullish CHoCH appears when price breaks upward after the previous structure was bearish.
A bearish CHoCH appears when price breaks downward after the previous structure was bullish.
CHoCH+ is a stronger change-of-character label. It appears when the change of character is supported by a stronger structural condition, such as a higher low for bullish context or a lower high for bearish context.
Internal BOS / CHoCH
These labels represent fast structure changes and are useful for short-term market reading.
Swing BOS / CHoCH
These labels represent higher-level structure and are generally more important for broader trend context.
Structure label text
The script includes two label text modes:
Full
Shows labels such as Internal BOS, Swing BOS, Internal CHoCH, and Swing CHoCH.
Short
Shows compact labels such as BOS, S-BOS, CHoCH, and S-CHoCH.
Important note about pivots
Market structure is based on confirmed pivots. Pivots require a selected number of bars to the left and right before they are confirmed. This means structure labels appear only after the pivot has been confirmed. Once a structure break is confirmed on bar close, the break label does not repaint after confirmation.
2. Volumetric Order Blocks
The indicator includes optional bullish and bearish order blocks.
Order Blocks are OFF by default.
Bullish Order Block
A bullish order block can be created after an internal bullish structure break.
The script scans the impulse leg and looks for the relevant candle zone that may represent demand context.
Bearish Order Block
A bearish order block can be created after an internal bearish structure break.
The script scans the impulse leg and looks for the relevant candle zone that may represent supply context.
Order Block visual design
Each order block can include:
* Main zone box
* Split buy/sell profile inside the zone
* Optional dashed mid-line
* Optional volume metrics label
The split-profile visual design is intended to give a quick view of how the bar’s volume was distributed inside the order block area.
Important note about volume split
The buy/sell split is an approximation. Pine Script does not provide historical tick-level buy/sell volume split. The script estimates the split from each candle’s close location inside its range and weights it by volume.
This should be understood as a visual approximation, not true bid/ask delta or true order-flow data.
Order Block mitigation
The script supports two mitigation methods:
Close
The order block is removed when price closes beyond the far edge of the zone.
Wick
The order block is removed when any wick moves beyond the far edge of the zone.
Hide Overlap
When enabled, the script avoids drawing overlapping order blocks on the same side. This is useful for keeping the chart clean.
Show Last
Controls how many active bullish and bearish order blocks remain visible on the chart.
Profile Width Bars
Controls the fixed width of the internal buy/sell profile inside the order block. The profile does not stretch with the full order block extension.
OB Body Transparency
Controls the background transparency of order block zones. Higher values make the order block background lighter.
3. Premium / Discount / Equilibrium Zones
The indicator includes optional Premium, Discount, and Equilibrium zones.
Premium / Discount Zones are OFF by default.
These zones are based on the active swing range.
Premium
The upper area of the current swing range.
Premium can help users identify where price is relatively high inside the selected swing range.
Discount
The lower area of the current swing range.
Discount can help users identify where price is relatively low inside the selected swing range.
Equilibrium
The middle area of the current swing range.
Equilibrium represents the middle reference area between the premium and discount zones.
Edge Zone Width
Controls the thickness of the Premium and Discount zones.
Equilibrium Half Width
Controls the width of the Equilibrium band around the midpoint.
Important note
Premium / Discount / Equilibrium zones are context tools only. They do not predict reversal or continuation by themselves.
4. Previous Day and Previous Week Levels
The indicator can display previous daily and weekly high/low levels.
These levels are OFF by default.
Previous Day High / Low
When enabled, the script plots:
* PDH: Previous Day High
* PDL: Previous Day Low
Previous Week High / Low
When enabled, the script plots:
* PWH: Previous Week High
* PWL: Previous Week Low
These levels are useful for identifying prior session liquidity areas, important reference levels, and possible reaction zones.
Daily levels are intended mainly for intraday charts.
Weekly levels are intended mainly for charts below the weekly timeframe.
5. Qualified Buy / Sell Setups
The indicator includes optional qualified BUY SETUP and SELL SETUP labels.
Buy/Sell Setups are OFF by default.
These are not automatic trade recommendations. They are conditional price-action setup labels based on the script’s structure and order block logic.
BUY SETUP logic
A BUY SETUP can appear when:
* price touches a bullish order block,
* the setup remains valid within the selected setup window,
* internal bullish BOS confirms after the touch,
* optional swing bias and premium/discount filters pass depending on selected setup quality.
SELL SETUP logic
A SELL SETUP can appear when:
* price touches a bearish order block,
* the setup remains valid within the selected setup window,
* internal bearish BOS confirms after the touch,
* optional swing bias and premium/discount filters pass depending on selected setup quality.
Setup Quality
The script includes three setup quality modes:
Strict
Strict mode requires more confirmation. It produces fewer setups but with more filtering.
Balanced
Balanced mode is the recommended middle setting. It allows setups when either the broader swing bias or premium/discount context supports the setup.
Aggressive
Aggressive mode requires less filtering. It produces more setups but can create more false or lower-quality events.
Setup Validity Bars
Controls how many bars are allowed between the order block touch and the internal BOS confirmation.
Signal Size
Controls the size of BUY SETUP and SELL SETUP labels.
Signal Distance From Candle
Uses ATR to place setup labels away from candles for better chart readability.
Important note about setup labels
BUY SETUP and SELL SETUP labels are not guaranteed buy or sell signals. They are visual setup conditions that should be confirmed with the user’s own analysis, market context, and risk management.
6. Fair Value Gap
The indicator includes optional Fair Value Gaps.
FVG is OFF by default.
Fair Value Gap definition
A Fair Value Gap is a 3-candle imbalance zone.
Bullish FVG
A bullish FVG forms when the current low is above the high from two bars back.
Bearish FVG
A bearish FVG forms when the current high is below the low from two bars back.
FVG Timeframe
The script can calculate FVGs from:
* the current chart timeframe,
* tick-based timeframes,
* second-based timeframes,
* minute-based timeframes,
* hourly timeframes,
* daily timeframes,
* weekly timeframe,
* monthly and multi-month timeframes.
Availability of tick and second timeframes depends on the symbol and the TradingView plan.
FVG Mitigation Method
The script supports four mitigation methods:
Close
A bullish FVG is mitigated when price closes through its far side. A bearish FVG is mitigated when price closes through its far side.
Wick
A bullish FVG is mitigated when a wick reaches through its far side. A bearish FVG is mitigated when a wick reaches through its far side.
Average
The FVG is mitigated when price reaches the midpoint of the imbalance.
None
The FVG remains visible until removed by the Show Last FVGs limit.
Extend Imbalance
Controls how many bars the FVG box extends to the right.
Volatility Threshold
Filters FVGs by size using ATR.
A value of 0 disables the filter.
For example, 0.25 means the FVG must be at least 0.25 ATR in size.
Show Last FVGs
Controls how many bullish and bearish FVGs remain visible on the chart.
Hide Overlap
When enabled, the script skips new overlapping FVGs on the same side to reduce chart clutter.
Show FVG Label
When enabled, the script displays Bull FVG or Bear FVG text inside the gap.
FVG Transparency
Controls how light or strong the FVG background appears.
7. Quick Guide Section
The indicator includes a Quick Guide group inside settings.
This section contains tooltip explanations for:
* Structure label meaning
* Setup logic meaning
* Fair Value Gap meaning
The goal is to make the indicator easier to understand directly from the settings panel.
8. Alerts
The script includes alert conditions for important structure and setup events.
Market Structure Alerts
* Internal Bullish BOS
* Internal Bullish CHoCH
* Internal Bearish BOS
* Internal Bearish CHoCH
* Swing Bullish BOS
* Swing Bullish CHoCH
* Swing Bearish BOS
* Swing Bearish CHoCH
Order Block Alerts
* Bullish OB Touched
* Bearish OB Touched
Qualified Setup Alerts
* Qualified Buy Setup
* Qualified Sell Setup
Fair Value Gap Alerts
* New Bullish FVG
* New Bearish FVG
Alerts are notifications only. They do not execute trades and should not be treated as financial advice.
How to use the indicator
A practical workflow:
1. Start with Swing Structure to understand the higher-level market direction.
2. Use Internal Structure to monitor faster short-term shifts.
3. Enable Order Blocks if you want supply/demand context.
4. Use Premium / Discount / Equilibrium zones to understand where price is trading inside the active swing range.
5. Enable Previous Day / Week levels if you want session and higher-timeframe reference levels.
6. Enable Fair Value Gaps if you want to study imbalance zones.
7. Enable Qualified Buy/Sell Setups only if you want the script to mark conditional setup labels.
8. Use alerts to monitor selected structure, order block, setup, or FVG events.
9. Combine all signals with your own market context, risk management, and confirmation process.
Recommended visual setup for a clean chart
For a clean default chart:
* Keep Order Blocks OFF unless you need them.
* Keep Buy/Sell Setups OFF unless you are studying setup confirmation.
* Keep FVG OFF unless you are specifically analyzing imbalance zones.
* Use Swing Structure for higher-level context.
* Use Internal Structure for short-term structure.
* Enable Daily / Weekly Levels only when relevant to your timeframe.
* Enable Premium / Discount only when studying the active swing range.
Limitations
This indicator does not predict future price movement.
It does not guarantee profitable trades.
It is not a trading strategy.
It does not place orders.
It does not provide broker execution.
It does not provide true historical bid/ask delta.
The buy/sell volume split inside order blocks is an approximation based on candle close position and volume.
Pivots confirm only after the selected number of bars.
Fair Value Gaps are 3-candle imbalance zones and do not guarantee continuation or reversal.
Buy/Sell Setup labels are conditional setup markers, not automatic trading instructions.
Previous Day and Previous Week levels are reference levels only.
Different markets, symbols, timeframes, and sessions can behave differently.
Users are responsible for their own trade decisions, risk management, and position sizing.
Originality and purpose
Price Action Structure combines multiple price-action tools into one organized workflow:
* internal and swing market structure,
* BOS / CHoCH / CHoCH+ labels,
* optional volumetric order blocks,
* approximated buy/sell split profile inside order blocks,
* premium, discount, and equilibrium zones,
* previous day and previous week levels,
* qualified buy/sell setup logic,
* optional Fair Value Gaps,
* multi-timeframe FVG selection,
* FVG mitigation options,
* alert conditions for key events.
The purpose of the indicator is to provide a clean and customizable price-action map that helps traders study market structure, imbalance, order block context, and setup confirmation in one place.
Educational disclaimer
This script is for educational and chart-analysis purposes only. It is not financial advice, investment advice, or a recommendation to buy or sell any financial instrument. Users should perform their own analysis and manage risk independently.
Notas de prensa
Update NotesThis update improves the visual clarity of Price Action Structure.
New improvements:
* Added HH / HL / LH / LL Swing Point labels.
* Added compact structure labels:
* I-BOS / I-CHoCH for internal structure.
* S-BOS / S-CHoCH for swing structure.
* Added label size control for structure labels.
* Added line width control for structure break lines.
* Improved default Swing Point label visibility.
* Reduced chart clutter by replacing long structure text with shorter labels.
No trading logic was changed in this update. The update is focused on readability, usability, and clearer market-structure visualization.
This indicator is intended for price-action analysis and does not guarantee future results.
Script de código abierto
Fiel al espíritu de TradingView, el creador de este script lo ha convertido en código abierto, para que los traders puedan revisar y verificar su funcionalidad. ¡Enhorabuena al autor! Aunque puede utilizarlo de forma gratuita, recuerde que cualquier republicación del código está sujeta a nuestras Normas internas.

Exención de responsabilidad
La información y las publicaciones no constituyen, ni deben considerarse como, asesoramiento o recomendaciones financieras, de inversión, de trading u otro tipo, proporcionadas o respaldadas por TradingView. Obtenga más información en Condiciones de uso.
Script de código abierto
Fiel al espíritu de TradingView, el creador de este script lo ha convertido en código abierto, para que los traders puedan revisar y verificar su funcionalidad. ¡Enhorabuena al autor! Aunque puede utilizarlo de forma gratuita, recuerde que cualquier republicación del código está sujeta a nuestras Normas internas.
Exención de responsabilidad
La información y las publicaciones no constituyen, ni deben considerarse como, asesoramiento o recomendaciones financieras, de inversión, de trading u otro tipo, proporcionadas o respaldadas por TradingView. Obtenga más información en Condiciones de uso.