OPEN-SOURCE SCRIPT
Williams %R - %R | TR
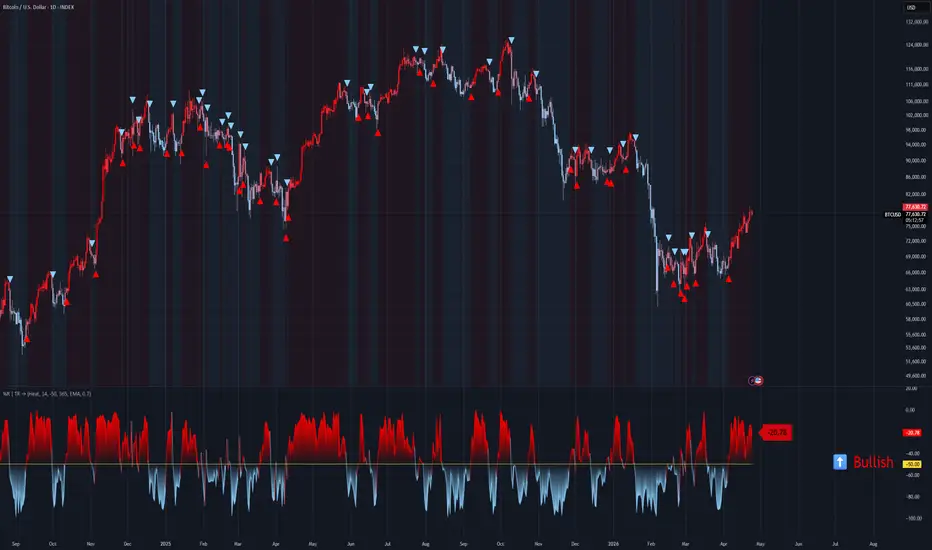
🎯 Overview
Williams %R – %R | TR is a modernised version of Larry Williams’ classic momentum oscillator. It measures the closing price relative to the highest high over a lookback period, producing values from -100 (oversold) to 0 (overbought). This implementation adds dynamic entry levels (either fixed 50 or a moving average of %R), gradient candle coloring, momentum‑based fill transparency, and nine color themes – turning a traditional indicator into a highly visual, adaptable trading tool.
Key Features
📐 Core Oscillator
Williams %R – Standard formula: (HighestHigh - Close) / (HighestHigh - LowestLow) * -100.
Values typically range from -100 (oversold) to 0 (overbought).
Reversed scale – Lower values indicate selling pressure, higher values indicate buying pressure.
🎯 Flexible Entry/Exit Signal
Option 1: Fixed 50 Level – Classic approach: cross above -50 = bullish, below -50 = bearish.
Option 2: %R Moving Average – Uses a smoothed line (many MA types available) as the dynamic threshold. Crosses of %R above/below its own MA generate signals.
🎨 Advanced Visualization
9 Color Themes – Same palette as TQI and SVZO (Classic, Modern, Heat, Robust, Accented, Monochrome, Moderate, Aqua, Cosmic).
Dynamic Fill Zones – Three fills: overbought zone (above entry), oversold zone (below entry), and a trend‑direction fill. Transparency changes with %R momentum.
Gradient Candle Coloring – Candles smoothly transition between bearish and bullish colors based on normalised %R.
Signal Markers – Triangles below/above bars on entry crosses.
Trend Table – Shows “Bullish” or “Bearish” in large coloured text.
Floating Value Label – Displays current %R value near the oscillator line.
📈 Signal System
Zero‑line cross? – No, Williams %R normally uses -50 or a dynamic MA as the threshold.
Entry signals – Bullish cross above the threshold, bearish cross below.
Persistent trend state – Remembers last direction until a crossover occurs.
Real‑time updates – Calculated on every bar.
How It Works
Calculation Logic
Williams %R – ta.wpr(Length_WillR) (TradingView’s built‑in function).
%R = (highest_high - close) / (highest_high - lowest_low) * -100
Entry Threshold – User chooses:
'50' → fixed -50 level
'%R MA' → moving average of %R (configurable length and type)
Moving Average Engine – Supports 12 types: EMA, SMA, RMA, WMA, VWMA, HMA, DEMA, TEMA, TRIMA, FRAMA, SWMA, T3 (with T‑Factor).
Normalised %R – Rescaled 0‑1 range using 70‑period min/max. Used for gradient colors.
Momentum – 5‑bar absolute change of %R, normalised against 50‑period max.
Fill transparency = 35 - (norm_momentum * 25) clamped 0‑100.
→ Higher momentum = less transparency (more visible fill).
Trend State Persistence
Trend_WillR = 1 (bullish) when %R > threshold, -1 (bearish) when %R < threshold.
Holds until a crossover happens – prevents flickering near the threshold.
Display Options
Visual Components
%R Line – Coloured by trend state (bullish/bearish) with 50% opacity.
Entry Line – Yellow horizontal line (fixed -50 or dynamic MA).
Fills:
Above entry → overbought zone (bullish fill with momentum‑based transparency).
Below entry → oversold zone (bearish fill with transparency).
Third fill → only in the current trend direction, adding emphasis.
Gradient Candles – Price bars change colour smoothly between down‑color and up‑color based on normalised %R.
Entry Signals – Triangles below (long) or above (short) bars on crossover.
Background – Very light tint matching the trend direction.
Value Label – Floating label near the %R line showing current value.
Trend Table – Middle‑right corner displays “Bullish” or “Bearish”.
Trading Signals
Entry Signals
LONG – %R crosses above the entry threshold (fixed -50 or %R MA).
→ Triangle below the price bar.
→ Candles turn bullish (gradient).
→ Background tints bullish.
SHORT – %R crosses below the entry threshold.
→ Triangle above the bar.
→ Candles turn bearish.
→ Background tints bearish.
Trend Confirmation
Strong Bullish – %R well above entry, rising, with low fill transparency (high momentum).
Strong Bearish – %R well below entry, falling.
Overbought zone – > -20 (approx). May precede a reversal; use with caution.
Oversold zone – < -80 (approx). May precede a reversal.
Divergence – Price makes a lower low but %R makes a higher low (bullish divergence) or vice versa.
Customization Settings
Technical Parameters
Length %R – Lookback period for Williams %R (default 14).
Entry/Exit Signal – Choose '50' (fixed -50) or '%R MA' (dynamic MA).
Length MA – Period for %R moving average (default 365 – very long, effectively a trend filter).
Moving Average – 12 types (EMA, SMA, RMA, WMA, VWMA, HMA, DEMA, TEMA, TRIMA, FRAMA, SWMA, T3).
T3 Factor – Only for T3 moving average (0.7 default).
Visual Parameters
Color Choice – 9 themes (all fills, candles, background, signals follow the theme).
Alert System
LONG – Triggered on bullish cross (above entry).
SHORT – Triggered on bearish cross (below entry).
Alerts include ticker symbol.
Williams %R – %R | TR is a modernised version of Larry Williams’ classic momentum oscillator. It measures the closing price relative to the highest high over a lookback period, producing values from -100 (oversold) to 0 (overbought). This implementation adds dynamic entry levels (either fixed 50 or a moving average of %R), gradient candle coloring, momentum‑based fill transparency, and nine color themes – turning a traditional indicator into a highly visual, adaptable trading tool.
Key Features
📐 Core Oscillator
Williams %R – Standard formula: (HighestHigh - Close) / (HighestHigh - LowestLow) * -100.
Values typically range from -100 (oversold) to 0 (overbought).
Reversed scale – Lower values indicate selling pressure, higher values indicate buying pressure.
🎯 Flexible Entry/Exit Signal
Option 1: Fixed 50 Level – Classic approach: cross above -50 = bullish, below -50 = bearish.
Option 2: %R Moving Average – Uses a smoothed line (many MA types available) as the dynamic threshold. Crosses of %R above/below its own MA generate signals.
🎨 Advanced Visualization
9 Color Themes – Same palette as TQI and SVZO (Classic, Modern, Heat, Robust, Accented, Monochrome, Moderate, Aqua, Cosmic).
Dynamic Fill Zones – Three fills: overbought zone (above entry), oversold zone (below entry), and a trend‑direction fill. Transparency changes with %R momentum.
Gradient Candle Coloring – Candles smoothly transition between bearish and bullish colors based on normalised %R.
Signal Markers – Triangles below/above bars on entry crosses.
Trend Table – Shows “Bullish” or “Bearish” in large coloured text.
Floating Value Label – Displays current %R value near the oscillator line.
📈 Signal System
Zero‑line cross? – No, Williams %R normally uses -50 or a dynamic MA as the threshold.
Entry signals – Bullish cross above the threshold, bearish cross below.
Persistent trend state – Remembers last direction until a crossover occurs.
Real‑time updates – Calculated on every bar.
How It Works
Calculation Logic
Williams %R – ta.wpr(Length_WillR) (TradingView’s built‑in function).
%R = (highest_high - close) / (highest_high - lowest_low) * -100
Entry Threshold – User chooses:
'50' → fixed -50 level
'%R MA' → moving average of %R (configurable length and type)
Moving Average Engine – Supports 12 types: EMA, SMA, RMA, WMA, VWMA, HMA, DEMA, TEMA, TRIMA, FRAMA, SWMA, T3 (with T‑Factor).
Normalised %R – Rescaled 0‑1 range using 70‑period min/max. Used for gradient colors.
Momentum – 5‑bar absolute change of %R, normalised against 50‑period max.
Fill transparency = 35 - (norm_momentum * 25) clamped 0‑100.
→ Higher momentum = less transparency (more visible fill).
Trend State Persistence
Trend_WillR = 1 (bullish) when %R > threshold, -1 (bearish) when %R < threshold.
Holds until a crossover happens – prevents flickering near the threshold.
Display Options
Visual Components
%R Line – Coloured by trend state (bullish/bearish) with 50% opacity.
Entry Line – Yellow horizontal line (fixed -50 or dynamic MA).
Fills:
Above entry → overbought zone (bullish fill with momentum‑based transparency).
Below entry → oversold zone (bearish fill with transparency).
Third fill → only in the current trend direction, adding emphasis.
Gradient Candles – Price bars change colour smoothly between down‑color and up‑color based on normalised %R.
Entry Signals – Triangles below (long) or above (short) bars on crossover.
Background – Very light tint matching the trend direction.
Value Label – Floating label near the %R line showing current value.
Trend Table – Middle‑right corner displays “Bullish” or “Bearish”.
Trading Signals
Entry Signals
LONG – %R crosses above the entry threshold (fixed -50 or %R MA).
→ Triangle below the price bar.
→ Candles turn bullish (gradient).
→ Background tints bullish.
SHORT – %R crosses below the entry threshold.
→ Triangle above the bar.
→ Candles turn bearish.
→ Background tints bearish.
Trend Confirmation
Strong Bullish – %R well above entry, rising, with low fill transparency (high momentum).
Strong Bearish – %R well below entry, falling.
Overbought zone – > -20 (approx). May precede a reversal; use with caution.
Oversold zone – < -80 (approx). May precede a reversal.
Divergence – Price makes a lower low but %R makes a higher low (bullish divergence) or vice versa.
Customization Settings
Technical Parameters
Length %R – Lookback period for Williams %R (default 14).
Entry/Exit Signal – Choose '50' (fixed -50) or '%R MA' (dynamic MA).
Length MA – Period for %R moving average (default 365 – very long, effectively a trend filter).
Moving Average – 12 types (EMA, SMA, RMA, WMA, VWMA, HMA, DEMA, TEMA, TRIMA, FRAMA, SWMA, T3).
T3 Factor – Only for T3 moving average (0.7 default).
Visual Parameters
Color Choice – 9 themes (all fills, candles, background, signals follow the theme).
Alert System
LONG – Triggered on bullish cross (above entry).
SHORT – Triggered on bearish cross (below entry).
Alerts include ticker symbol.
Script de código abierto
Fiel al espíritu de TradingView, el creador de este script lo ha convertido en código abierto, para que los traders puedan revisar y verificar su funcionalidad. ¡Enhorabuena al autor! Aunque puede utilizarlo de forma gratuita, recuerde que cualquier republicación del código está sujeta a nuestras Normas internas.

Exención de responsabilidad
La información y las publicaciones no constituyen, ni deben considerarse como, asesoramiento o recomendaciones financieras, de inversión, de trading u otro tipo, proporcionadas o respaldadas por TradingView. Obtenga más información en Condiciones de uso.
Script de código abierto
Fiel al espíritu de TradingView, el creador de este script lo ha convertido en código abierto, para que los traders puedan revisar y verificar su funcionalidad. ¡Enhorabuena al autor! Aunque puede utilizarlo de forma gratuita, recuerde que cualquier republicación del código está sujeta a nuestras Normas internas.
Exención de responsabilidad
La información y las publicaciones no constituyen, ni deben considerarse como, asesoramiento o recomendaciones financieras, de inversión, de trading u otro tipo, proporcionadas o respaldadas por TradingView. Obtenga más información en Condiciones de uso.