Highs & Lows_Neo - Daily & 4H Levels
# Highs & Lows_Neo — Daily & 4H Levels
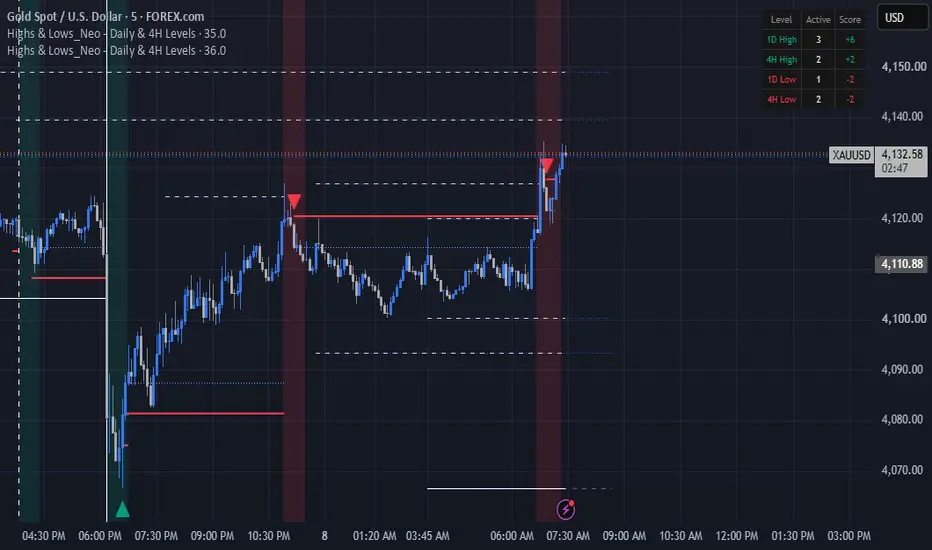
**Highs & Lows_Neo** is a market-structure and liquidity-level indicator designed to help traders monitor important **previous Daily and 4H highs and lows**, identify when those levels are broken, and observe the market's reaction around them.
The indicator focuses on keeping higher-timeframe levels visible while providing additional information about active levels, break zones, and potential entry signals.
## 🔹 Key Features
### 📊 Previous Daily Highs & Lows
Display previous Daily highs and lows as horizontal levels.
You can customize:
* Number of Daily periods displayed
* High and Low colors
* Line style
* Timeframe used to calculate the levels
The default setting displays the previous **5 Daily periods**.
### 📈 Previous 4H Highs & Lows
The indicator also tracks previous 4H highs and lows.
You can customize:
* Number of 4H periods displayed
* High and Low colors
* Line style
* Timeframe used for calculation
The default setting displays the previous **5 4H periods**.
### 🎯 Active Level Tracking
Each Daily and 4H level remains active until it is mitigated.
Two mitigation methods are available:
**High/Low**
* A level is considered reached when price's High or Low touches/breaks the level.
**Close**
* A level is considered reached only when the candle closes through the level.
This gives traders control over how strictly a level should be considered broken.
### ⚡ Break Zones
When an active level is broken, the indicator can display a temporary vertical background zone.
The zone duration is configurable in minutes.
These zones are designed to highlight the period immediately following a level break, where traders can watch for potential reactions and setups.
### 📉 Optional 1-Minute RSI Signals
An optional RSI-based signal model is included.
When enabled:
* A Daily/4H resistance break zone can look for a **SELL** condition when 1-minute RSI crosses back below the overbought level.
* A Daily/4H support break zone can look for a **BUY** condition when 1-minute RSI crosses back above the oversold level.
RSI length, overbought, and oversold levels are configurable.
### 🔄 Candle-Based Signals
When the RSI signal mode is disabled, the indicator uses its built-in candle-based reaction logic around the broken level.
After a resistance break, the indicator looks for bearish candle confirmation and a break of the relevant candle low.
After a support break, it looks for bullish candle confirmation and a break of the relevant candle high.
The indicator also tracks the reaction after a signal and limits the number of trades within the same zone.
### 🧮 Level Score Table
The table in the top-right corner provides a quick overview of currently active higher-timeframe levels.
It displays:
| Level | Active | Score |
| ------- | ------------: | -------------: |
| 1D High | Active levels | Positive score |
| 4H High | Active levels | Positive score |
| 1D Low | Active levels | Negative score |
| 4H Low | Active levels | Negative score |
Daily levels carry a larger score weight than 4H levels.
This makes the table useful as a quick visual reference for the amount of higher-timeframe liquidity that remains active.
### 🟢🔴 Level Break Markers
The indicator can display vertical markers when the active level count reaches zero.
These markers help identify moments when the currently tracked Daily or 4H levels have been fully mitigated.
### 🔗 Overlapping Level Management
When a 4H level overlaps with an active Daily level at essentially the same price, the overlapping 4H level is removed from the active 4H set.
This helps reduce duplicate levels and keeps the chart cleaner.
## ⚙️ Main Settings
**Mitigation Source**
* High/Low
* Close
**Right Offset**
Controls how far active levels extend into the future.
**Daily Levels**
* Enable/Disable
* Number of periods
* Timeframe
* High/Low colors
* Line style
**4H Levels**
* Enable/Disable
* Number of periods
* Timeframe
* High/Low colors
* Line style
**Signals**
* Enable/Disable 1-minute RSI signals
* RSI length
* RSI overbought
* RSI oversold
**Vertical Zones**
* Enable/Disable
* Zone duration
* Bullish/Bearish break colors
## 📌 How I Use the Indicator
The main purpose of this indicator is not to tell you to blindly buy or sell every time price reaches a level.
Instead, use the Daily and 4H levels as **areas of interest**.
When price approaches or breaks an important level, watch the reaction:
**Resistance / High**
→ Price breaks a previous high
→ Monitor the break zone
→ Look for bearish rejection/reaction
→ Optional RSI confirmation can be used
→ SELL signal may appear according to the selected signal model
**Support / Low**
→ Price breaks a previous low
→ Monitor the break zone
→ Look for bullish rejection/reaction
→ Optional RSI confirmation can be used
→ BUY signal may appear according to the selected signal model
The indicator is therefore intended to provide **context and structure**, rather than replace trade management or independent analysis.
## ⚠️ Important
This indicator is a technical-analysis tool and does not guarantee profitable trades.
Signals should be evaluated together with:
* Market structure
* Volatility
* Session conditions
* Risk management
* Higher-timeframe context
* News and market conditions
Always test the indicator on your preferred market and timeframe before using it in live trading.
**For educational and analytical purposes only.**
**Highs & Lows_Neo** is a market-structure and liquidity-level indicator designed to help traders monitor important **previous Daily and 4H highs and lows**, identify when those levels are broken, and observe the market's reaction around them.
The indicator focuses on keeping higher-timeframe levels visible while providing additional information about active levels, break zones, and potential entry signals.
## 🔹 Key Features
### 📊 Previous Daily Highs & Lows
Display previous Daily highs and lows as horizontal levels.
You can customize:
* Number of Daily periods displayed
* High and Low colors
* Line style
* Timeframe used to calculate the levels
The default setting displays the previous **5 Daily periods**.
### 📈 Previous 4H Highs & Lows
The indicator also tracks previous 4H highs and lows.
You can customize:
* Number of 4H periods displayed
* High and Low colors
* Line style
* Timeframe used for calculation
The default setting displays the previous **5 4H periods**.
### 🎯 Active Level Tracking
Each Daily and 4H level remains active until it is mitigated.
Two mitigation methods are available:
**High/Low**
* A level is considered reached when price's High or Low touches/breaks the level.
**Close**
* A level is considered reached only when the candle closes through the level.
This gives traders control over how strictly a level should be considered broken.
### ⚡ Break Zones
When an active level is broken, the indicator can display a temporary vertical background zone.
The zone duration is configurable in minutes.
These zones are designed to highlight the period immediately following a level break, where traders can watch for potential reactions and setups.
### 📉 Optional 1-Minute RSI Signals
An optional RSI-based signal model is included.
When enabled:
* A Daily/4H resistance break zone can look for a **SELL** condition when 1-minute RSI crosses back below the overbought level.
* A Daily/4H support break zone can look for a **BUY** condition when 1-minute RSI crosses back above the oversold level.
RSI length, overbought, and oversold levels are configurable.
### 🔄 Candle-Based Signals
When the RSI signal mode is disabled, the indicator uses its built-in candle-based reaction logic around the broken level.
After a resistance break, the indicator looks for bearish candle confirmation and a break of the relevant candle low.
After a support break, it looks for bullish candle confirmation and a break of the relevant candle high.
The indicator also tracks the reaction after a signal and limits the number of trades within the same zone.
### 🧮 Level Score Table
The table in the top-right corner provides a quick overview of currently active higher-timeframe levels.
It displays:
| Level | Active | Score |
| ------- | ------------: | -------------: |
| 1D High | Active levels | Positive score |
| 4H High | Active levels | Positive score |
| 1D Low | Active levels | Negative score |
| 4H Low | Active levels | Negative score |
Daily levels carry a larger score weight than 4H levels.
This makes the table useful as a quick visual reference for the amount of higher-timeframe liquidity that remains active.
### 🟢🔴 Level Break Markers
The indicator can display vertical markers when the active level count reaches zero.
These markers help identify moments when the currently tracked Daily or 4H levels have been fully mitigated.
### 🔗 Overlapping Level Management
When a 4H level overlaps with an active Daily level at essentially the same price, the overlapping 4H level is removed from the active 4H set.
This helps reduce duplicate levels and keeps the chart cleaner.
## ⚙️ Main Settings
**Mitigation Source**
* High/Low
* Close
**Right Offset**
Controls how far active levels extend into the future.
**Daily Levels**
* Enable/Disable
* Number of periods
* Timeframe
* High/Low colors
* Line style
**4H Levels**
* Enable/Disable
* Number of periods
* Timeframe
* High/Low colors
* Line style
**Signals**
* Enable/Disable 1-minute RSI signals
* RSI length
* RSI overbought
* RSI oversold
**Vertical Zones**
* Enable/Disable
* Zone duration
* Bullish/Bearish break colors
## 📌 How I Use the Indicator
The main purpose of this indicator is not to tell you to blindly buy or sell every time price reaches a level.
Instead, use the Daily and 4H levels as **areas of interest**.
When price approaches or breaks an important level, watch the reaction:
**Resistance / High**
→ Price breaks a previous high
→ Monitor the break zone
→ Look for bearish rejection/reaction
→ Optional RSI confirmation can be used
→ SELL signal may appear according to the selected signal model
**Support / Low**
→ Price breaks a previous low
→ Monitor the break zone
→ Look for bullish rejection/reaction
→ Optional RSI confirmation can be used
→ BUY signal may appear according to the selected signal model
The indicator is therefore intended to provide **context and structure**, rather than replace trade management or independent analysis.
## ⚠️ Important
This indicator is a technical-analysis tool and does not guarantee profitable trades.
Signals should be evaluated together with:
* Market structure
* Volatility
* Session conditions
* Risk management
* Higher-timeframe context
* News and market conditions
Always test the indicator on your preferred market and timeframe before using it in live trading.
**For educational and analytical purposes only.**

Exención de responsabilidad
La información y las publicaciones no constituyen, ni deben considerarse como, asesoramiento o recomendaciones financieras, de inversión, de trading u otro tipo, proporcionadas o respaldadas por TradingView. Obtenga más información en Condiciones de uso.
Exención de responsabilidad
La información y las publicaciones no constituyen, ni deben considerarse como, asesoramiento o recomendaciones financieras, de inversión, de trading u otro tipo, proporcionadas o respaldadas por TradingView. Obtenga más información en Condiciones de uso.